
A Short History of Prices, Inflation since the Founding of the U.S.
Fernando M. Martin
Federal Reserve Bank of St. Louis, Q2 2017
Economists generally agree that a central bank that is independent of political pressure is a prerequisite for sound monetary policy.1 However, in recent years, there have been numerous proposals to subject the conduct of monetary policy of the U.S. central bank—the Federal Reserve—to formal and close congressional oversight beyond what is already taking place.2 One prime justification for these proposals is the significant increase in the price level since the establishment of the Fed in 1913.
The purpose of this article is not to discuss the merits or shortcomings of the various proposals, but rather to provide some historical context to this rationale by revisiting some basic facts about prices and inflation since the founding of the country.
Price Levels from the Beginning
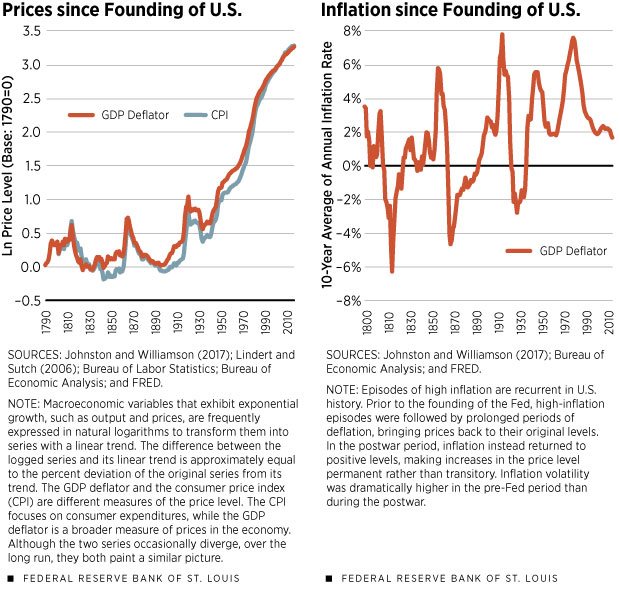
Figure 1 displays the yearly average of the price level (measured in logarithms) in the U.S. from 1790 until 2016. Two series measuring the price level are displayed: the gross domestic product (GDP) deflator and the consumer price index (CPI).3 The former measures average prices of all new, domestically produced final goods and services in the economy, while the latter measures average prices of the typical expenditure basket of an urban consumer.4Although there are important and occasionally significant differences between the two series, they both paint a similar overall picture, which can be summarized with three points.
- First, there appear to be at least two different “eras” characterizing the behavior of prices. Their precise boundaries are hard to establish, but the first era seems to have lasted from the founding of the U.S. until around the establishment of the Federal Reserve or perhaps as late as the entry in World War I. The second era begins around World War II and continues until the present day. The period in between is difficult to assign to either era, as things might have turned out quite differently had the U.S. not entered either world war. Overall, prices seem to move around a stable average during the pre-Fed era, while they have increased steadily since World War II.
- Second, despite the previous observation, high-inflation episodes are sprinkled throughout U.S. history. In fact, there are several temporary and significant increases in the price level in both eras.
- Third, most of the price increase in the postwar period seems to have been concentrated in just two, albeit perhaps prolonged, episodes.
The behavior of prices throughout U.S. history was linked to whether the value of the dollar was fixed in terms of gold and/or silver. (See sidebar.) The U.S. started under what was effectively a silver standard and subsequently adopted a gold standard in 1834. It remained on it until 1913, except for convertibility suspensions in 1838-1843 and especially during the Civil War and its aftermath, 1861-1878.
The gold standard broke down around the world during World War I and was replaced by the Gold Exchange Standard from 1925 until 1931, when Britain abandoned the system. After World War II, the Bretton Woods System had central banks exchange U.S. dollars for gold at a fixed price. Although the system arguably constrained Fed policy, it did not involve convertibility of dollars to gold for individuals or firms, as was the case with previous metallic standards. The system eventually collapsed in 1971.5
Figures 1 and 2
A Look at Inflation
Let us inspect the data a bit closer by looking at the change of prices instead of their level. Figure 2 shows inflation, measured as the yearly increase in the GDP deflator.6 Inflation is averaged over 10 years to remove short-term fluctuations and instead focus on long-run trends. Each data point in the chart corresponds to the average annual inflation experienced over the previous 10 years.
Before World War II, episodes of high inflation were followed by periods of deflation, which explains the fact that the price level moved around a stable average. These inflationary episodes correspond to periods during which convertibility of the dollar to gold and/or silver was suspended to meet the demand for additional government revenue, most notably during the Civil War and World War I. Deflationary periods followed as convertibility was reinstated and prices returned to their pre-war levels. Although the price level was stable over the long run, inflation was very volatile during this period.7
Starting with World War II, there were two important inflationary episodes, which explain a significant share of the price increase in the postwar period. The first is the war itself, as inflation rose during the war and then to partly pay for the public debt accumulated to finance it.8
The second is the period known as the stagflation of the 1970s, a combination of high inflation and low output growth resulting from various external oil shocks and incorrect or misguided monetary policy. High inflation was effectively defeated during Paul Volcker’s tenure as Fed chairman (1979-1987), and inflation has remained low and stable since.
The postwar period exhibits the same recurrence of high inflation episodes as the preceding period, but with the significant difference that the lack of adherence to a metal-backed monetary system made the price level increase permanent rather than transitory. As a result, however, inflation volatility decreased significantly in the postwar period.
Measuring Volatility
A straightforward way to measure volatility, especially informative when averages differ substantially, is the coefficient of variation. This measure is defined as the ratio between the standard deviation and the mean of a given variable. A higher coefficient of variation implies a higher volatility of a variable around its mean. For the pre-Fed period (1790-1913), the average annual inflation was 0.4 percent with a coefficient of variation of 13.2. During the period 1941-2016, these figures changed to 3.5 percent and 0.8, respectively. If we look at the post-Volcker era (1988-2016), annual inflation was 2.2 percent on average with a coefficient of variation of 0.4.
In other words, with the joint creation of the Fed and the abandonment of metal convertibility of the currency, the economy traded off higher inflation for more stable inflation. Higher inflation is generally bad, as it taxes nominal asset holdings and cash transactions. More-stable inflation is generally good, as it makes the future easier to predict, resulting in more-efficient economic decisions, lower costs of long-term (nominal) contracts and increased stability of the financial system.
In addition, eliminating the need for deflation avoids having to endure the potentially costly and gradual process of price and wage reduction. Furthermore, many households get hurt by deflation since the real burden of their debt (e.g., payments on a mortgage with a fixed-interest rate) increases as prices and nominal wages fall.
Although average annual inflation since 1941 is higher, it is not dramatically higher than in the pre-Fed period: 0.4 percent vs. 3.5 percent. In contrast, volatility decreased tremendously: 13.2 vs. 0.8. Arguably, then, the costs were small while the gains large.
Furthermore, episodes of high inflation, which carry high economic costs, are nothing new and instead a recurrent feature in U.S. history. In this regard, the important difference between the pre-Fed and the postwar eras is that these high-inflation episodes were previously followed by prolonged deflation and, in the more recent era, by a return to normal (and positive) inflation rates.
Fernando M. Martin is an economist at the Federal Reserve Bank of St. Louis. For more on his work, see https://research.stlouisfed.org/econ/martin. Research assistance was provided by Andrew Spewak, a research associate at the Bank.
Endnotes
- In fact, the leading cause of high inflation is the willingness of central banks to finance government deficits by printing money. [back to text]
- Note that the Fed is already held accountable to the public and Congress. For example, see www.federalreserve.gov/faqs/about_12798.htm. [back to text]
- Data for the GDP deflator until 1928 are taken from Johnston and Williamson, who used a variety of sources. Data on CPI until 1912 are taken from Lindert and Sutch. All other data come from the Bureau of Economic Analysis and the Bureau of Labor Statistics and are available for free from FRED. See https://fred.stlouisfed.org/series/A191RD3A086NBEA and https://fred.stlouisfed.org/series/CPIAUCNS. [back to text]
- The personal consumption expenditures (PCE) price index, which is the Fed’s preferred measure of the price level, is available yearly since 1929; over such a long period, it is almost indistinguishable from the GDP deflator. [back to text]
- For more information on the gold standard, see sidebar, Bordo and Elwell. [back to text]
- As suggested by Figure 1, using CPI inflation would not change the chart significantly. [back to text]
- St. Louis Fed economist David Wheelock made a similar observation in a post on The FRED Blog. See https://fredblog.stlouisfed.org/2015/02/how-did-the-u-s-economy-perform-under-the-pre-fed-gold-standard. [back to text]
- Ohanian estimated that postwar inflation (1946-1948) resulted in a repudiation of debt worth about 40 percent of output. [back to text]
References
Bordo, Michael D. “The Classical Gold Standard: Some Lessons for Today,” Federal Reserve Bank of St. Louis Review, May 1981, pp. 2-17.
Elwell, Craig K. “Brief History of the Gold Standard in the United States,” Congressional Research Service, June 2011.
Johnston, Louis; and Williamson, Samuel H. “What Was the U.S. GDP Then?” MeasuringWorth, 2017. See www.measuringworth.org/usgdp.
Lindert, Peter H.; and Sutch, Richard. “Consumer price indexes, for all items: 1774-2003,” Historical Statistics of the United States, Millennial Edition, eds. Carter, Susan B.; Gartner, Scott S.; Haines, Michael R.; Olmstead, Alan L.; Sutch, Richard; and Wright, Gavin. New York, N.Y.: Cambridge University Press, 2006. See http://hsus.cambridge.org/HSUSWeb/toc/showTablePdf.do?id=Cc1-2.
Ohanian, Lee E. The Macroeconomic Effects of War Finance in the United States: Taxes, Inflation, and Deficit Finance. New York, N.Y., and London: Garland Publishing, 1998.
