
Kimberly Bayard, Emin Dinlersoz (U.S. Census Bureau), Timothy Dunne (University of Notre Dame), John Haltiwanger (University of Maryland), Javier Miranda (U.S. Census Bureau), and John Stevens 1
New businesses play an important role in overall economic activity. They account for a sizable share of job creation, and they provide a key source of innovation that contributes to overall productivity growth.2 Furthermore, recent research suggests that young firms may be particularly sensitive to business cycles.3 Until now, however, the data sources that provide policymakers and researchers with information on new business formations have only been available with a considerable lag.3 Our recent paper, “Early-Stage Business Formation: An Analysis of Applications for Employer Identification Numbers (PDF)” documents the development of the Business Formation Statistics (BFS), a new public-use data product that offers timely, geographically detailed, and comprehensive information on the formation of new businesses. A beta release is now available on the Census Bureau’s website and is described in a recent Census Bureau blog entry.
The BFS are derived from applications for Employer Identification Numbers (EINs) submitted to the Internal Revenue Service (IRS) and from the Census Bureau’s comprehensive database of U.S. business establishments and companies, the Business Register. The BFS data are available at a quarterly frequency from 2004:Q3–2017:Q3 (with future quarterly updates planned) both for the United States and for each of the 50 states and the District of Columbia. For each level of geography, the dataset includes a set of series that describe various counts of EIN applications and a set of series that describe actual and projected business formations. Both seasonally adjusted and non-seasonally adjusted data are provided. The discussion below summarizes how we constructed the data sets; a detailed explanation can be found in our paper.
EIN Applications and Business Formations
The IRS assigns unique EINs to entities that are required to file various business tax returns. Applications for EINs are submitted on a rolling basis, and the application form collects information on a number of characteristics, including the name and address of the applicant, the name and address of the business, the reason for applying, the type of business entity (for example, corporation, partnership, nonprofit, etc.), the principal activity of the business, whether there are plans to hire employees, and the planned date of initial wage payments. Each week, the IRS transmits the applications–along with the assigned EINs–to the Census Bureau to help keep up-to-date the Business Register and associated sampling frames for business surveys.
Figure 1 shows the raw set of quarterly EIN applications after we’ve excluded some application groups that are least likely to become employer businesses or are located outside of the United States. We refer to these as “business applications,” and there are a few important observations. First, there are about 650,000 business applications per quarter, on average, far more than the 450,000 business startups per year reported in the Census Bureau’s Business Dynamics Statistics (BDS).4 Second, there is a clear seasonal pattern in the quarterly applications data–applications are highest in the first quarter of each year and tend to fall in each subsequent quarter. Third, EIN applications declined about 12 percent in the Great Recession, but they have since recovered and the most recent data (for 2017:Q3) are well above pre-recession levels.
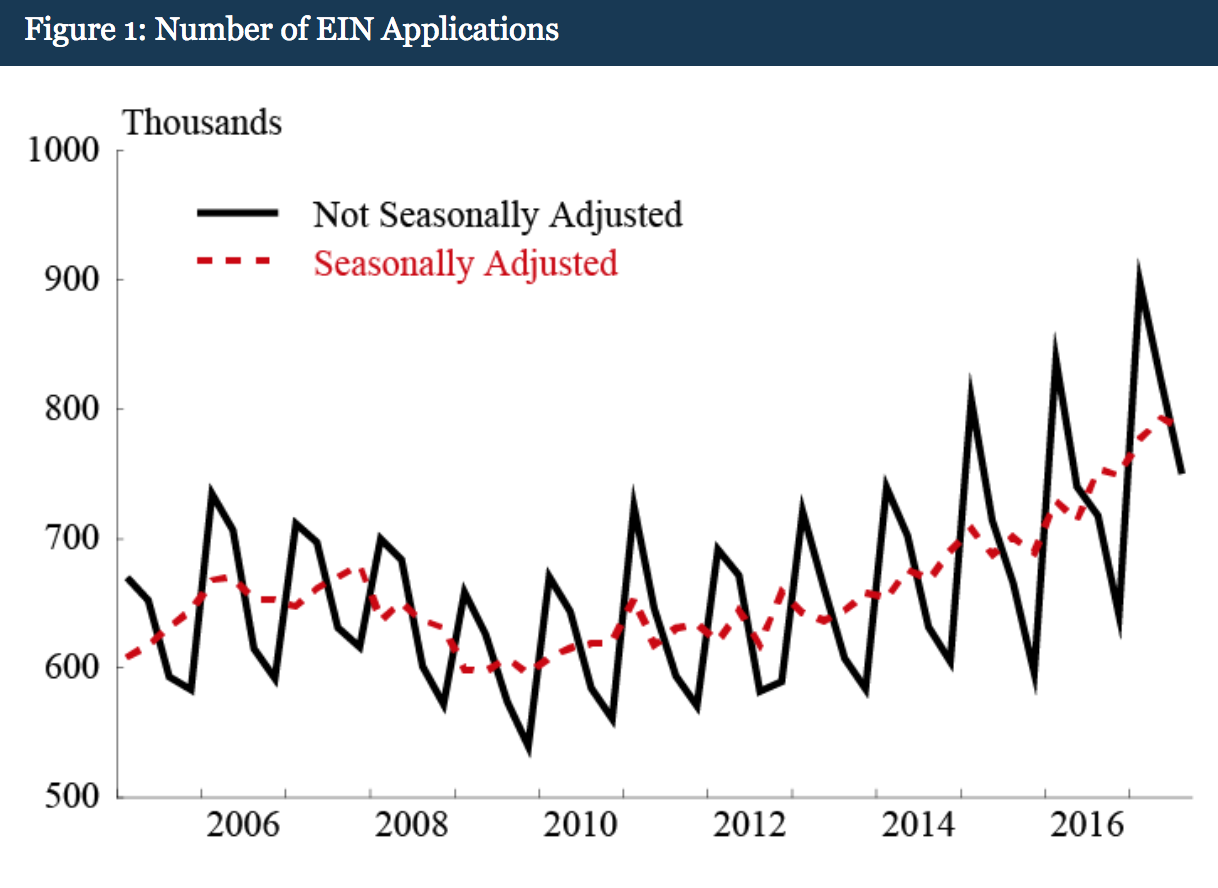
The discrepancy between the number of business applications and the number of actual businesses formed in a year indicates that a straight read of the aggregate applications data is not a good measure of new business formation. That said, business applications may be indicative of economic activity more broadly (such as general economic conditions or business sentiment), and they are therefore included as distinct data series in the public-use BFS data set. Furthermore, the EIN applications include detailed geographic information about the applicant’s location, and our paper highlights some cases where business applications are closely correlated with local economic activity.
Still, an important goal is to see if we can generate forward-looking measures of new business formation from the applications data. To get a sense of whether certain subsets of business applications might be adequate to predict business formation, Figure 2 shows three different categories of EIN applications alongside firm births from the BDS (all series are indexed to 100 in 2005). The broad set of business applications (the solid black line) is an annualized version of the applications series shown in Figure 1, and as noted above, this group has rebounded strongly since the previous recession. In contrast, two other groups of applications fell steeply during the recession and have either continued to decline or have shown only modest gains since then: We call the first measure “Business Applications with Planned Wages” (the dashed-and-dotted blue line) because they have indicated a date on which they will pay wages; and we call the second measure “High Propensity Business Applications” (the dashed red line) because they meet a wide set of criteria broadly suggestive of future business formation. Both of these measures of applications have been rather stagnant in the past few years, not unlike actual firm births in the BDS (the dashed-and-dotted green line).

Modeling Business Formations from EIN Applications
The disparate paths of the applications series provide further evidence that we can’t rely solely on applications to predict firm births. However, we can use the individual characteristics on the EIN applications to construct an econometric model that predicts business formations. The process is not straightforward, and there are a number of data challenges to overcome.
The first step toward estimating expected firm births from the applications data is to link the EIN applications to the Census Bureau’s comprehensive list of businesses, the Business Register. This linkage lets us see which applications eventually become employer businesses. The match process is trivial because both data sets contain EINs, however, the Business Register is only available with a lag (the most recent year available is 2015) whereas the EIN applications are available in a timely manner. Nevertheless, for the period that the applications data overlap with the Business Register, we can see which applications transition to employer businesses and which do not.
One complicating factor is that among the applications that eventually become employer businesses, there is no fixed amount of time between the date the application is submitted to the IRS and the date that business becomes operational; some applications turn into businesses within weeks, while others may take years. As we note in the paper, about 75 percent of the applications that transition to employer businesses do so within four quarters after the date of submission. Because of the variation in time-to-transition, we model the probability that an application becomes an employer business in the 4 (or 8) quarters after the application was submitted.6
More formally, we estimate the probability P^igt+kP^igt+k that application i in geography g transitions to an employer business over the period t+k as
Where F is estimated with a probit specification, Zigt is a set of variables that are taken from the application, and β^gtβ^gt is an estimate of the unknown parameters. The set of predictors, Zigt, includes only information that comes from the applications. These variables include indicators for the type of entity, the reason for applying, industry, and the wage date variables discussed above; a number of interactions between variables are also included.
The predicted application-level probabilities, P^igt+kP^igt+k, can be used to construct an estimate of the expected number of business formations by time t+k as
This approach amounts to reweighting each application by the predicted probability (propensity score) that the application becomes an employer business between t and t+k. Estimates are generated for each of the 50 states and the District of Columbia, and the time frequency is quarterly. Note that the measure of projected business startups, S^gt+kS^gt+k, is forward looking. It provides an estimate of the number of new businesses that will appear from a given cohort of applications in a specific geographic area over a particular horizon. The measure is not an estimate of the total number of businesses that will form within a given quarter, or other specific time window.
The model that projects the number of business formations within four quarters of an EIN application is based on the sample of applications received between 2012 and 2014. The estimated parameters are used to both forecast and back-cast business formation outside of the estimation period. Figure 3 shows actual and projected business formations that occur within four quarters of the submission date of an EIN application. The solid black line–actual business formation–ends in the fourth quarter of 2014 because the most recent Census data on actual startups only goes through the fourth quarter of 2015. The red line–projected business formation–begins in the first quarter of 2009 and ends in the third quarter of 2017.
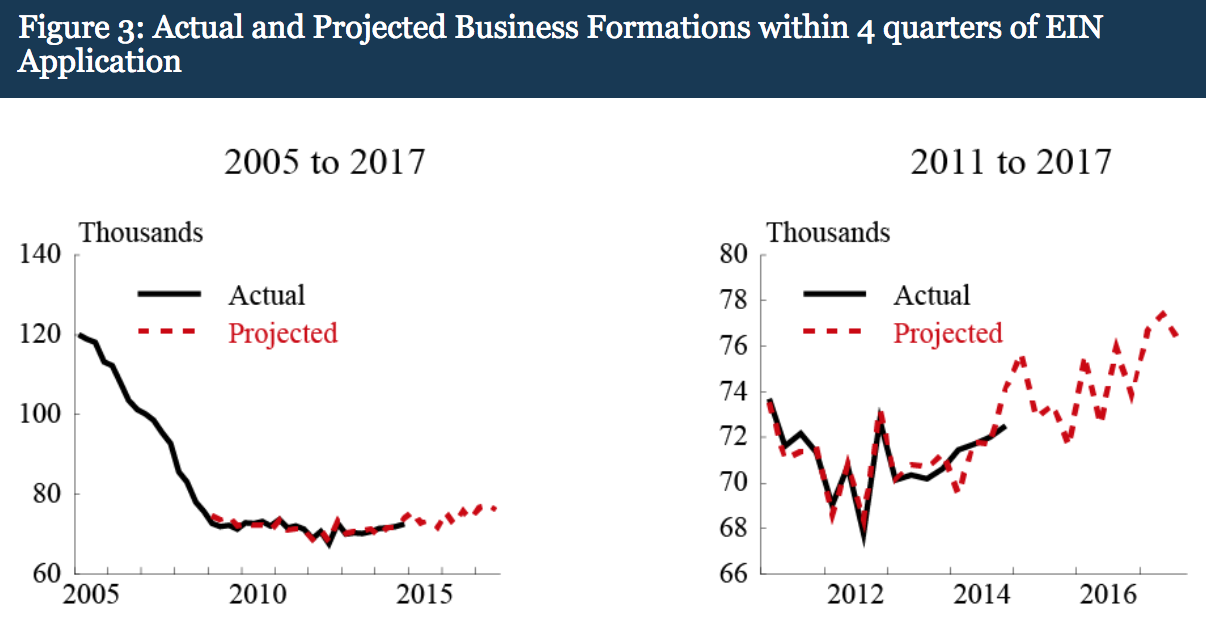
For the period that they overlap, the projected number of business formations generally aligns well with actual business formations.7 The panel on the left shows actual and projected business formations between 2005 and 2017. Actual business formations began to decline prior to the Great Recession, and they fell sharply through 2009 before flattening out in 2010. Although it is difficult to ascertain in the figure, the model estimates a slightly higher number of business formations than actually occurred in 2009 and a slightly lower number in 2013. In addition, the model also captures the direction of the quarterly changes in those years. The panel on the right shows the period from 2011 through 2017; smoothing through the volatility for 2014 forward, the model projects a broad increase in new businesses. Nevertheless, total business formations in recent years are projected to remain well below pre-recession levels.
State-level detail
The discussion above focuses on business applications and formations at the national level. However, one beneficial feature of the BFS is the state-level detail available in the public-use datasets. There are few comprehensive high-frequency indicators of real-time economic activity at the state level, so the BFS should prove useful to regional analysts.
Business formation varies across states and this variation is stable over time. Figure 4 shows business formations per high-propensity business application for five selected states (North Dakota, Missouri, California, Illinois, and Florida) and for the United States as a whole.8 The rate at which EIN applications transition to employer businesses varies substantially across states. From 2005:Q1 through the 2017:Q3 (the last quarter of available data), the average rate for North Dakota is about 0.4, more than twice the average rate for Florida. Not surprisingly, the rate for North Dakota, the state with the smallest population among those shown, is more volatile than that of the other states. The rates for Illinois are a bit below the national average, while the rates for California are slightly above.
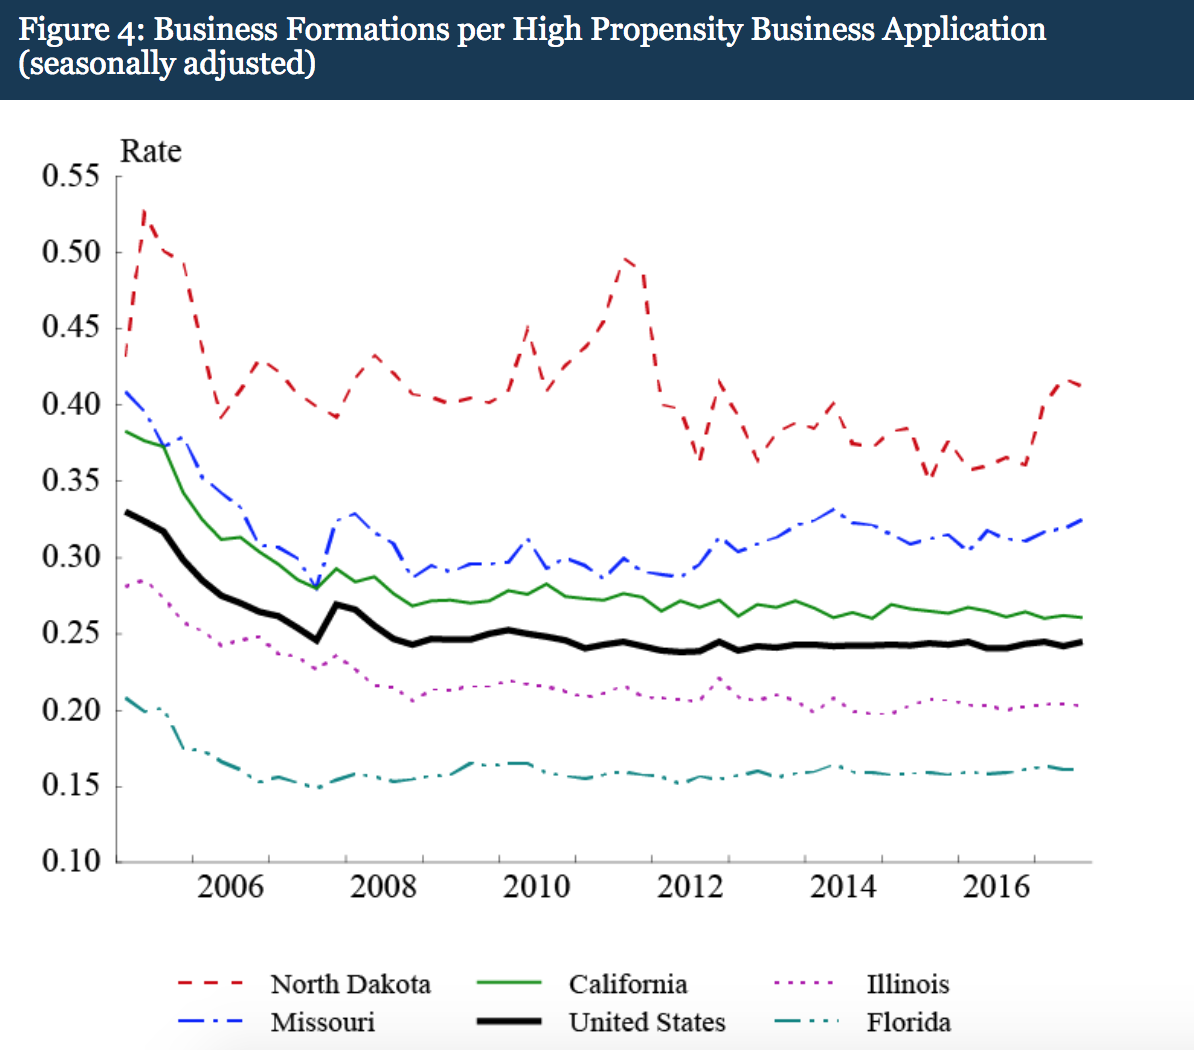
In addition, for the set of selected states, the relative ranking of the number of business formations per high-propensity application is stable over the past 10 years. To some degree, this is a reflection of the specific states chosen. Nevertheless, it is generally true that states with low (or high) rates of business formation per application in the mid-2000s continue to have low (or high) rates 10 years later.
Conclusion
Business applications data provide a novel, timely, and granular way to track new business formations. Using the information contained in an application for a new Employer Identification Number, we generate accurate and timely indicators of business startup activity at the national and local levels. The public-use data, the Business Formation Statistics, include projections as well as various measures of business applications so that users can develop their own approaches and interpretations of these novel series.
1. Part of this research was conducted when Timothy Dunne was with the Federal Reserve Bank of Atlanta. The views and opinions expressed herein are those of the authors and do not reflect the views of the U.S. Census Bureau, the Federal Reserve Board, or the Federal Reserve Bank of Atlanta. All results have been reviewed to ensure no confidential information is disclosed.
2. Decker, Ryan, John Haltiwanger, Ron Jarmin, and Javier Miranda (2014). “The Role of Entrepreneurship in U.S. Job Creation and Economic Dynamism,” Journal of Economic Perspectives, vol. 28, no. 3; pp. 3-24.
3. Fort, Teresa, John Haltiwanger, Ron Jarmin, and Javier Miranda (2013). “How Firms Respond to Business Cycles: The Role of Firm Age and Firm Size”, IMF Economic Review, v.61, iss. 3, pp.520-59.
4. The most wide-ranging data set for examining new business formations–the U.S. Census Bureau’s Business Dynamics Statistics–is currently available only through 2015.
5. The number of EIN applications greatly exceeds the number of business formations most likely because there are a very large number of sole proprietorships in the applications data that do not transition to employer businesses.
6. The paper describes how we adjust for the timing of EIN applications within a quarter, so that applications received at the beginning or end of the quarter are being treated symmetrically with respect to the time that we look ahead for a business formation.
7. The analysis in the paper provides detailed statistics of fit for the projections.
8. The business formation values are actual business formations through 2014:Q4 spliced together with projected business formations thereafter.
