
by Christoph Lakner
Co-Authors: Mario Negre, Jose Cuesta, Ani Wilwal
In earlier blogposts on recent trends in inequality, we had referred to measurement issues that make this exercise challenging. In this blogpost we discuss two such issues: the underlying welfare measure (income or consumption) used to quantify the extent of inequality within a country, and the fact that estimates of inequality based on data from household surveys are likely to underreport incomes of the richest households. There are a number of other measurement challenges, such as those related to survey comparability, which are discussed in Poverty and Shared Prosperity 2016 – for a focus on Africa, also see Poverty in a Rising Africa, published earlier in 2016.
Household surveys, our main source of inequality measures, track either income or consumption expenditure. Countries vary in terms of which measure is used – the Industrialized Countries and Latin America tend to use income surveys, while South Asia, Sub-Saharan Africa, and the Middle East use consumption. Given the fact that richer households tend to consume a smaller share of their incomes than poorer households (or equivalently, the rich have higher saving rates than the poor), estimates of inequality based on consumption would underestimate the extent of inequality. In the database that was used in Chapter 4 of Poverty and Shared Prosperity 2016 (also see this blog), about half of all surveys in 2013 use income, although this ratio varies markedly by region. In other words, our data would systematically understate the level of inequality in countries where consumption data are used, compared to analysis in which only income surveys were used.
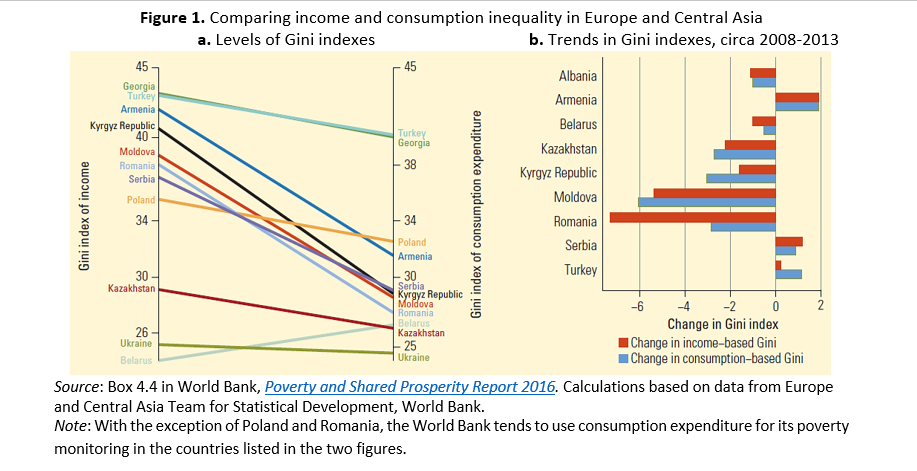
In Figure 1, we examine some countries in Eastern Europe and Central Asia, where it is possible to compute the Gini index, the most commonly used measure of inequality, using both income and consumption surveys for the same year. From panel a, it is clear that (the level of) inequality tends to be lower when consumption expenditure is used instead of income. However, the ranking of countries by their Gini index is somewhat robust to the choice of welfare measure – for example, Georgia and Turkey remain the two most unequal countries in the sample. Of course, this only considers ranks within a region, not across the world, and it is important that comparisons between,say, Latin America and Sub-Saharan Africa are done carefully because of the different welfare aggregates used in the two regions (see this blog).
For the analysis of changes in inequality over time – for example see this blog – it is reassuring that the time trends are similar irrespective of the welfare measure (panel b). While there are some large differences (notably, Romania), both welfare aggregates point in the same direction, and one aggregate does not produce a consistently smaller change than the other.
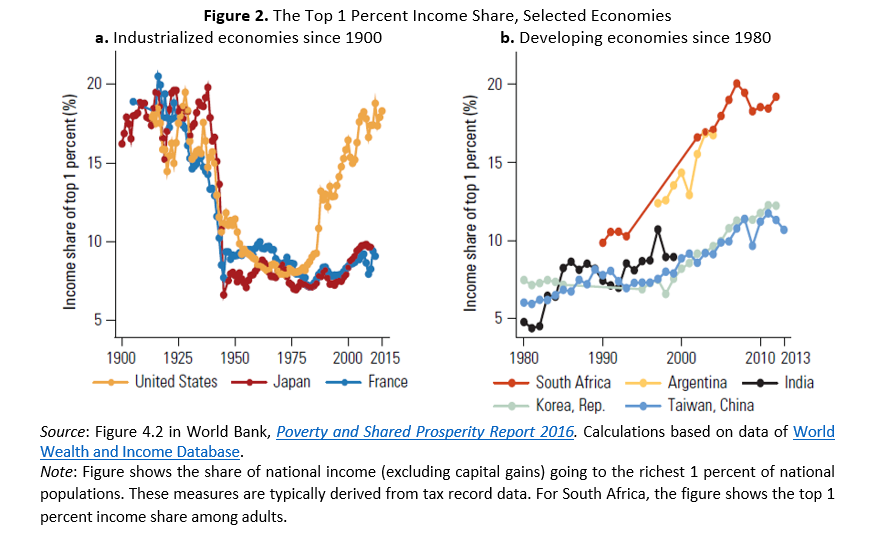
Another measurement challenge that we face is accurately estimating the incomes (or consumption) at the top. Many people think that top incomes are rising more quickly than average incomes in a number of countries. With the limited data that we have, Figure 2, panel a, shows that the income share of the richest 1 percent in the United States has been rising steeply since the 1970s after falling in the first half of the 20th century. In contrast, in France and Japan, not only do the richest control a much smaller share of national income, but their share has also risen much less. This is remarkable because all three countries had similar top income shares at the beginning of the 20th century. The long-run evidence on developing economies is more limited because of the lack of tax record data. Figure 2, panel b, shows some developing economies since the 1980s for which the top 1 percent income share also increased. In South Africa, the share of the top 1 percent roughly doubled over a period of 20 years and is comparable to the levels observed in the United States.
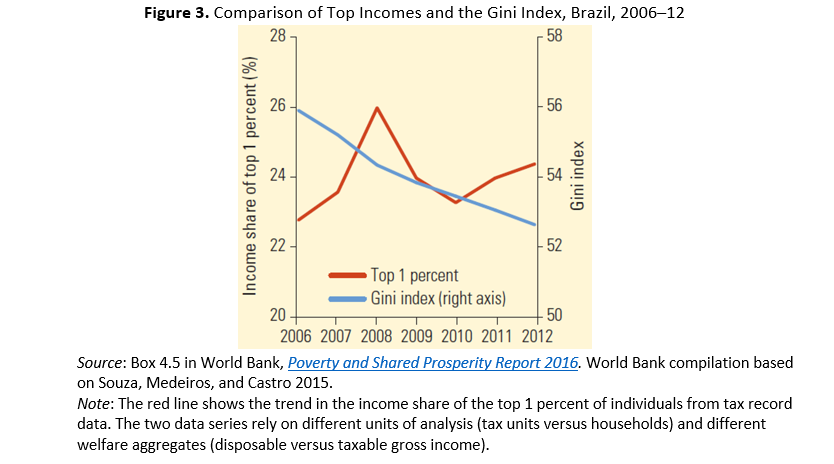
An important question is whether a more accurate measure of top incomes would reverse the conclusions that we reach from household surveys on inequality trends. Figure 3 compares the income share of the top 1 percent and the Gini index of Brazil between 2006 and 2012. While the Gini index has been falling steadily over this period, by almost 4 Gini points, the top income share has been on a slight upward trend – the divergence is most visible during the earlier and later periods. Part of this divergence may derive from differences in definition, such as the use of tax units versus households or of gross incomes versus disposable incomes. But this evidence may also suggest that the Gini index misses important changes in the top tail, because it is derived from a household survey and because it is not a measure that focuses on the top tail.
These two measurement challenges highlight the need for better and more data to improve our knowledge on inequality, especially in developing countries around the world. While consumption data are absolutely crucial for measuring poverty, in emerging economies, where own-consumption is becoming less important and wage-employment is becoming the norm, more attention ought to be paid to income data (also see the discussion here). Although the evidence presented above showed that measures of income and consumption inequality moved similarly, there can be no general presumption that this would always be the case. In developing countries, the availability of tax record data remains limited, and, where they are available, data quality may be problematic given the absence of broad income taxes in many developing countries and the incomplete taxation of capital incomes. Some studies have explored the use of alternative data on the top tail, such as real estate prices, as well as combining top data with household surveys to get a better picture of the overall distribution. While better measurement and data certainly take time and money, they remain crucial for making public policies more efficient and equitable.
Source: Let’s Talk Development
