
The Housing Supply Puzzle: Part 1, Divergent Markets
by Evan Karson, Joseph McGillicuddy, and B. Ravikumar
Over the past several months, the pace of U.S. home sales has shown few signs of growth, and as of February 2018, overall home sales were only slightly higher compared with year-ago levels. Analysts have pointed to a tight housing supply as the key constraint holding back the housing market. However, statistics on housing inventories indicate shortages only for existing homes, while the supply of new homes remains at a relatively healthy level. Existing and new home supplies typically move in sync, which poses an important question: What has changed to prompt this decoupling?
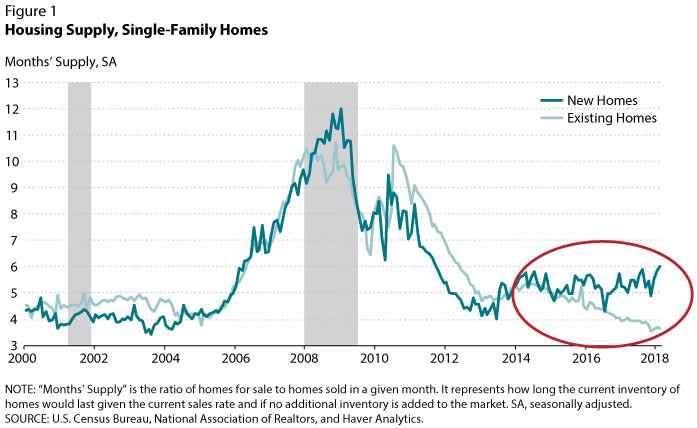
One statistic used to gauge the health of housing inventories is the ratio of homes for sale to homes sold in a given month. This ratio, known as “months’ supply,” represents how long the current inventory of homes would last given the current sales rate and if no additional inventory is added to the market. Historically, the months’ supplies of new and existing homes have moved in tandem since new and existing homes tend to be close substitutes. However, Figure 1 shows that in 2015 the relative supplies of new and existing homes began moving in different directions: The supply of new homes remained relatively unchanged while the supply of existing homes fell to a historically low 3.6 months’ worth of inventory. This divergence implies that new and existing homes have possibly become weaker substitutes for one another.
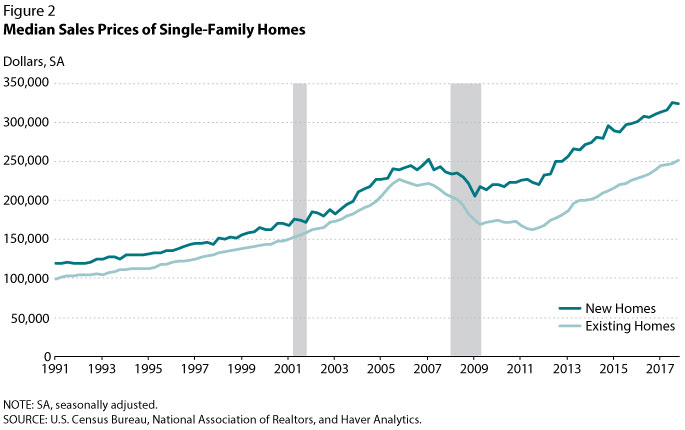
To the extent that price reflects quality, recent home price data (Figure 2) reveal that the difference in quality between new homes and existing homes has widened over the past few years. In 2006, the median sales price of new single-family homes was just 10 percent above the median sales price of existing single-family homes. Since 2010, that gap has averaged over 30 percent. Statistics on housing characteristics and amenities similarly illustrate that new homes have been rising in quality. From 2010 to 2016, the average square footage of new homes increased by 10 percent, a significant increase over the trend seen from 1990 up to the 2007-09 recession. Over the same post-recession period, the fraction of new homes with at least four bedrooms increased from 35 percent to 46 percent, and the fraction of new homes with at least three bathrooms rose from 25 percent to 37 percent.
Why have new homes gotten nicer? One reason might be that as the recession hit, homebuilders focused more heavily on the high-end housing market where buyers were less affected by the economic downturn. Since then, rising construction costs, labor shortages, and a lack of desirable lots have pushed builders to continue operating in the upper end of the market where profit margins are higher. As a result, homebuyers looking for lower- and middle-tier housing have been increasingly priced out of the new-home market and forced to operate predominantly in the existing-home market.1 This influx of buyers into the existing-home market has, in part, resulted in slimmer inventories and widened the gap in housing supplies.
What else might be contributing to this divergence in housing supplies? Several possibilities include the following: First, demand for affordable housing may have independently become more robust over the past few years because of improved household balance sheets and aging millennials beginning to consider homeownership. Second, current owners of lower- and middle-tier housing may be unwilling or unable to trade up to new, high-priced homes, creating gridlock in the market. Third, investors purchased homes in large numbers following the recession. Because rental demand has strengthened since 2007, those investors may be disinclined to sell right now. Fourth, the stronger rental market may have also prompted homebuilders to shift construction from single-family homes to multifamily units.
We address some of these factors in Part 2 (“Rental Demand”) and Part 3 (“Price Gaps”) of this series. Analysis of other potential drivers of the divergence is left to further research. Regardless, the current housing situation is unlikely to be resolved until homebuilders begin catering to buyers of lower-tier homes. Given that developers continue to face the same supply constraints that pressured them to focus on premium homes, the current shortage of affordable housing is likely to persist.
1 In Figure 1, the first divergence of the two housing-supply series, from late-2010 to 2013, also appears to be related to this segmentation of the market. Some of the divergence may be attributed to the expiration in 2010 of a temporary tax credit for first-time homebuyers, which might have disproportionately affected the market for affordable housing and thus the market for existing homes.
The Housing Supply Puzzle: Part 2, Rental Demand
In Part 1 (“Divergent Markets”) of this three-part series, we document that the recent divergence in inventories of new and existing homes seems to reflect a scarcity of lower- and middle-tier homes. We now examine one potential factor contributing to this shortage: rental demand. Specifically, we investigate two channels through which this factor may have affected the supply of housing: increased conversion of single-familyproperties into rental units and a shift in new residential construction from single-familyto multifamily units.
Over roughly the past decade, there has been a dramatic shift away from homeownership in favor of renting. According to the U.S. Census Bureau American Community Survey (ACS), in 2016 there were over 7 million additional renter-occupied housing units (including both single-family and multifamily structures) relative to 2006—an increase of 20 percent. Over the same 10-year period, the number of owner-occupied housing units remained unchanged and the national homeownership rate fell to 63 percent, the lowest annual level recorded by the U.S. Census Bureau since 1965. This movement toward renting is visible across all age groups. During the period, homeownership rates fell by 10 percentage points for young households, 6 percentage points for middle-aged households, and 2 percentage points for older households.1 As the shift occurred, rental rates climbed relative to home prices, as reflected by a 20 percent drop in the home price-to-rent ratio between 2006 and 2016.
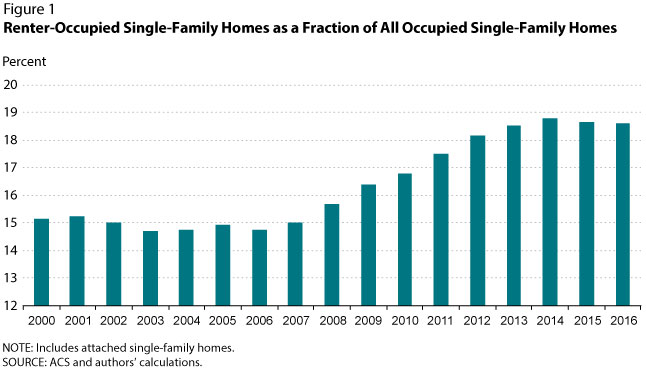
One way the strengthening of rental demand has potentially decreased the supply of lower- and middle-tier homes is through an increase in renter occupancy of single-family properties. This trend may have reduced housing inventories because rental homes tend to be bought and sold less frequently than owner-occupied homes since landlords can hold on to properties as households move in and out. The ACS shows that renters accounted for nearly 19 percent of households living in single-family units in 2016, up from around 15 percent in 2006 (Figure 1). This reflects an increase of 3.8 million renter-occupied single-family units, which accounts for a large fraction of the 4.8 million-unit increase in total occupied single-family homes over that time frame. In addition, over the same time period, households with below-median income made up over 70 percent of all households that switched from homeownership to renting single-family housing.2
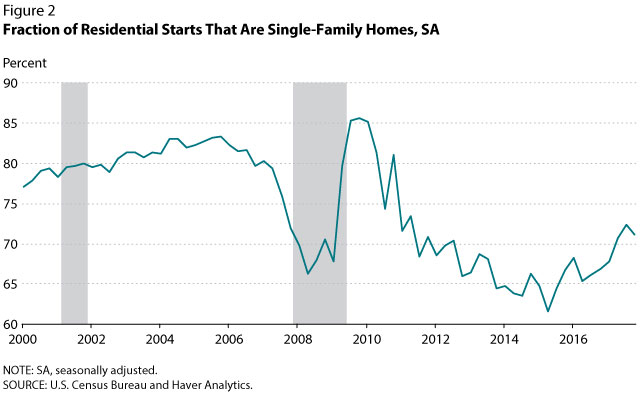
Increased rental demand has also likely reduced inventories of homes through its effect on new construction. The growth of rents relative to home prices after 2006 incentivized developers to concentrate more on multifamily construction. The fraction of all residential-unit starts in buildings with at least five units doubled from 16 percent in 2006 to 32 percent in 2016. And single-family construction projects declined sharply from 81 percent to 67 percent of all housing starts over the same 10-year period (Figure 2).
While both the increase in renter occupancy of single- family homes and the shift toward multifamily construction appear to have contributed to the current housing shortage, these trends seem to be easing as growth in rental demand has started to wane.3 Home prices have been growing faster than rents in recent years. If this continues, lessors may become inclined to sell, freeing up inventory. A rising home price-to-rent ratio may also encourage homebuilders to take on more single-family projects. The fraction of housing starts that are single-family units has already begun to rise, reaching 71 percent as of the fourth quarter of 2017 (the average from 2000 to 2006 was 81 percent). These trends are likely to be slow moving, meaning that any major inventory relief through these channels will take some time.
In Part 3 (“Price Gaps”) of this series, we conclude our analysis by discussing recent trends across housing tiers and their potential effects on the housing supply.
Notes
1 We define young, middle-aged, and older households as those with heads of household younger than 45 years old, 45-64 years old, and 65 years old and over, respectively. Homeownership rates are calculated using data from the U.S. Census Bureau.
2 Calculated using data from the U.S. Census Bureau Current Population Survey.
3 Based on data from the U.S. Census Bureau, the total number of renter- occupied housing units has remained effectively constant since the beginning of 2016 after consistently rising for over a decade.
The Housing Supply Puzzle: Part 3, Price Gaps
In Part 1 (“Divergent Markets”) of this series, we argue that the recent divergence in housing supplies likely signals a decline in inventories of lower- and middle-tier homes nationwide. Part 2 (“Rental Demand”) discusses the role that rental-market developments have played in exacerbating this shortage. In this third and final essay, we document another trend that might have contributed to the scarcity of lower- and middle-tier homes: the widening price gaps between different housing tiers.
In recent years, the differences in quality between housing tiers—that is, upper-tier, middle-tier, and lower-tier homes—have widened significantly insofar as price reflects quality. According to data from the real estate company Zillow, the median prices of upper-tier and middle-tier homes rose by 7 percent and 4 percent, respectively, from 2010 to 2014.1 By comparison, the median price of lower-tier homes declined by 1 percent. This means that, over the four-year period, the difference in median prices between upper-tier and middle-tier homes increased by 11 percent, while the difference between middle- and lower-tier homes increased by 12 percent.
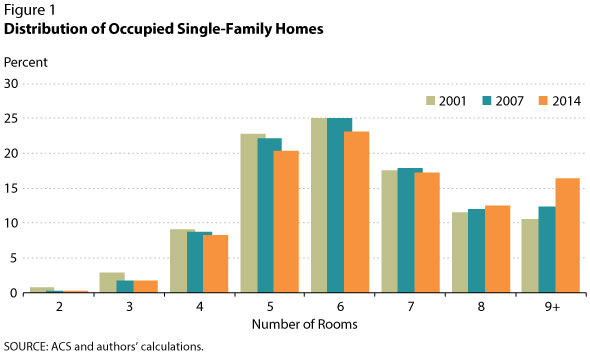
Additionally, the Census Bureau American Community Survey (ACS) provides suggestive evidence that the distribution of the U.S. housing stock, though slow moving, has skewed toward extremely large homes, which may have magnified the price gap between middle-tier and upper-tier homes. Figure 1 shows that the fraction of occupied single-family homes with at least 9 rooms edged higher from 2001 to 2007, rising from about 11 percent to 12 percent. This trend accelerated in the years following, as homes with at least 9 rooms reached 16 percent of all occupied single-family homes in 2014. Meanwhile, the shares of every other size group either shrank or remained essentially unchanged over the entire 13-year span. These changes to the stock of U.S. homes in part reflect the cumulative effect of inflows of new, large homes. As we illustrate in Part 1 of this essay series, homebuilders have concentrated more heavily on developing upper-tier single-family homes in recent years.2
One way larger price gaps could reduce the supply of lower- and middle-tier homes is by making it relatively more expensive for owners to trade up. That is, when homeowners cannot trade up to better houses, they cannot make new inventory available by selling their old homes. Between 2010 and 2014, the median number of years that homeowners stayed in their homes before selling ticked up from 8 years to 10 years, the highest level ever recorded by the National Association of Realtors.3
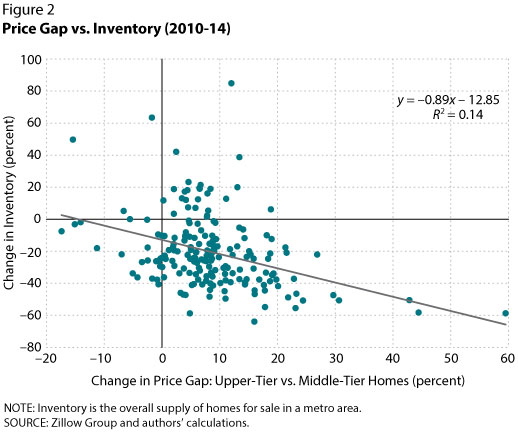
To examine the relationship between price gaps and inventories, we look at changes in the characteristics of housing markets across the United States from 2010 to 2014. Figure 2 illustrates that in a sample of the 185 largest metro areas, there is a negative relation between the price spread for upper-tier homes relative to middle-tier homes and the overall supply of homes for sale. The spread in San Francisco, for example, rose from $330,000 to $480,000 between 2010 and 2014 while inventory declined by 60 percent. Over the same period, the price gap in Philadelphia rose from $140,000 to only $160,000 while inventory declined by just 20 percent.
Outlook
In 2017, lower-tier homes experienced the strongest price growth (9 percent), followed by middle-tier homes (7 percent), and then upper-tier homes (5 percent), resulting in narrower price gaps between housing tiers.4 Rising prices of lower-tier and middle-tier homes should draw homebuilders to produce more of those units over time, while a smaller price gap will incentivize owners to trade up, yielding additional inventory. In the near-term, however, it is likely that low- and middle-income homebuyers will suffer as affordability worsens in those market segments.
Notes
1 Zillow defines a home as bottom-tier/middle-tier/upper-tier if its estimated price falls in the bottom/middle/top third of all estimated home values in a given geographic area.
2 Renovations and tear-downs also impact the distribution of home size and quality. Renovations tend to increase overall size and quality. The effects of tear-downs on the distribution depends on the relative size and quality of the homes being destroyed, though outflows from demolitions have been historically smaller than inflows from new construction.
3 Kusisto, Laura and Rexrode, Christina. “Stuck in Place, U.S. Homeowners Hunker Down as Housing Supply Stays Tight.” October 29, 2017; https://www.wsj.com/articles/stuck-in-place-u-s-homeowners-hunker-down-as-housing-supply-stays-tight-1509274802.
4 The 9 percent price growth of lower-tier homes is consistent with the average seen in 2005-06, before the Great Recession.
Source: Federal Reserve Bank of St. Louis
