@TBPInvictus here, with a simple question:
How much credit does Trump deserve for the current state of the economy?
This should be easy to answer, but it has Trump himself keeps confusing fact and fiction, making this blurry int he eyes of some. Objective observers wonder why the compulsion to exaggerate what would normally be considered good economic data, spinning it from fact to fiction in one exaggeration after another.
Especially since is so easy to verify that data — this is simply perplexing to any rational, thinking economic player.
So let’s consider the data, specifically as it relates to this question: Did Trump actually accomplish something, or in a case of life repeating, i.e. did he just get lucky with what he inherited? In other words: How materially different is the Trump Economy to the Obama Economy?
According to the conservative commentariat, the spin is coming not from Trump, but former president Barack Obama, who purportedly took credit for the state of the economy, and was wrong to do so.
Here is conservative Eric Bolling:
Watching @BarackObama take credit for @realDonaldTrump successes is disgraceful.
Score So Far-
TRUMP:
-Unemployment Rate
-GDP
-Wage Growth
-# Blacks Employed
-# Hispanics Employed
-# Women Employed
-ISIS Wins
-Homegrown Terror EventsOBAMA:
-Slick Speaking
-School Shootings— Eric Bolling🇺🇸 (@ericbolling) September 7, 2018
And here is Don Jr., also blaming Obama for a bad economy and saying his dad fixed it:
Obama claiming this economy may be the dumbest thing I’ve ever heard. Anyone with a brain knows his policies of over regulation, excessive taxation, and general hatred of business killed growth for his entire 8 years. There’s not a single stat where we aren’t better off today. https://t.co/WANThNjQs3
— Donald Trump Jr. (@DonaldJTrumpJr) September 8, 2018
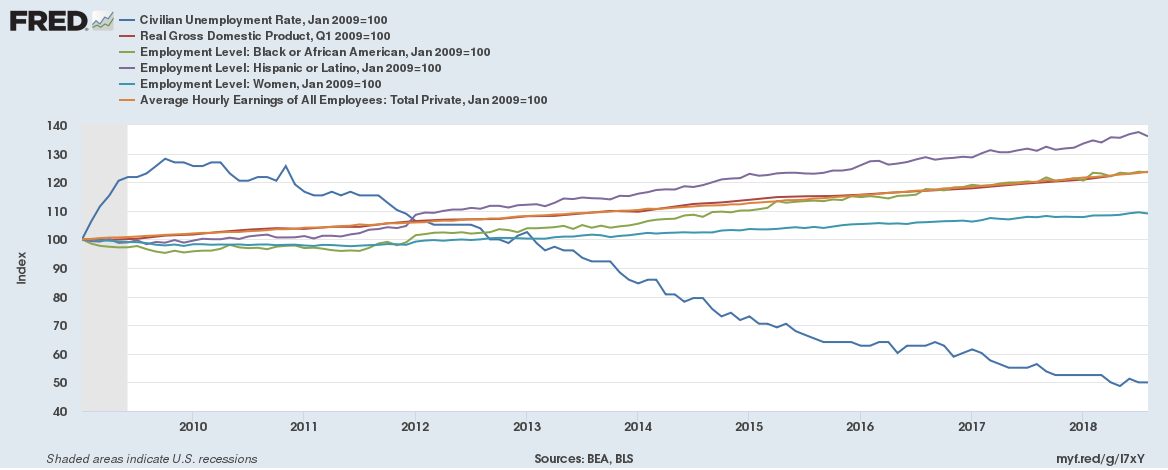
Well, let’s have a look at all six of the items Eric Bolling chose to highlight — all in one handy chart.
The St. Louis Fed’s FRED service let’s us do this very easily. We can index all six metrics to 100 at January 2009, when Obama took office, and see how they’ve been doing since. If there’s been a significant improvement (or even reversal of a undesirable trend) since January 2017, it should be easily visible.
So, what do we see?
To my eyes, what we see is essentially that nothing has changed in the last 19 months from what was going on before it. The uptrends in labor market measures for Blacks, Hispanics, women all remain intact. So too does the trend in GDP. And the trend in average hourly earnings continues apace, just as the unemployment rate continues trending lower.
Have a look at this chart — it’s un-doctored, except I hid the x-axis labels showing the years. Can you determine when Trump took office? When his policies went into place? Where the Trump economic surge is? How confident are you in your ability to identify that uptick? (Meaning, how much would you be willing to bet on that?)
Spot the Trump Surge . . .
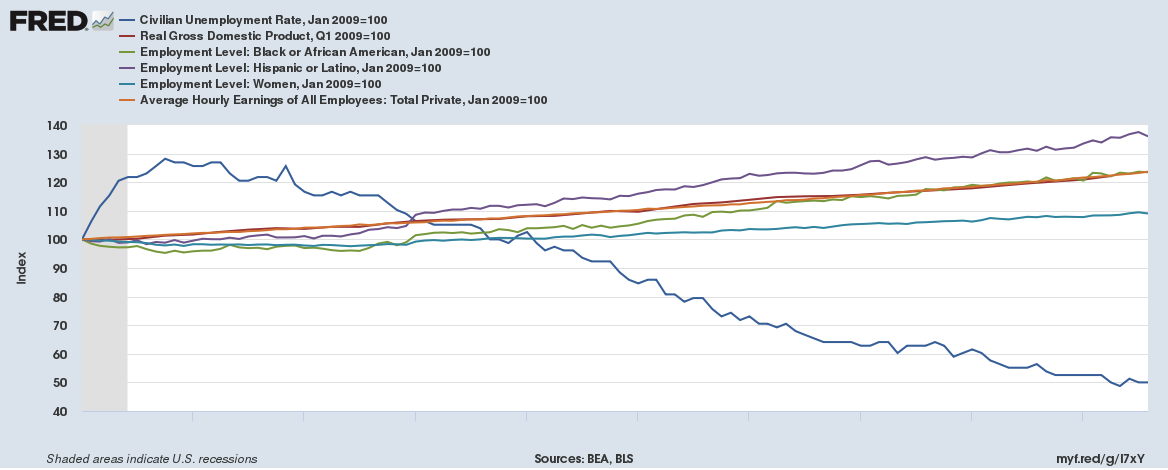
Note: For the version showing years, see the chart (after the jump) at page bottom.
The claim that Trump Economy is all that different from the Obama economy — for Civilian Unemployment, for Employment levels of Blacks or Hispanics or Women, for Real GDP or for nominal hourly wages — is unsupported by the actual BLS and BEA data. For the budget deficit, on the other hand, CBO reports the deficit is noticeably wider under Trump than what he inherited from his predecessor, and likely to get even worse.
Notwithstanding the desire to refute the gaslighting bullshit from Bolling and Junior Mint, I should state for the record that presidents generally get (or in Trump’s case claim) far too much credit (or blame) for both economic successes and failures; their influence is really fairly limited — unless they really screw up. (See Barry’s prior on this, here, here and here).
Perhaps the biggest economic difference between 44 and 45 area is Trump’s focus on jobs for Coal Miners. It was a huge part of Trump’s campaign, and he has undertaken enormous steps to bring back coal. How much of impact is he having? See the chart below.
Guess how many coal jobs were created over the past 3 months? 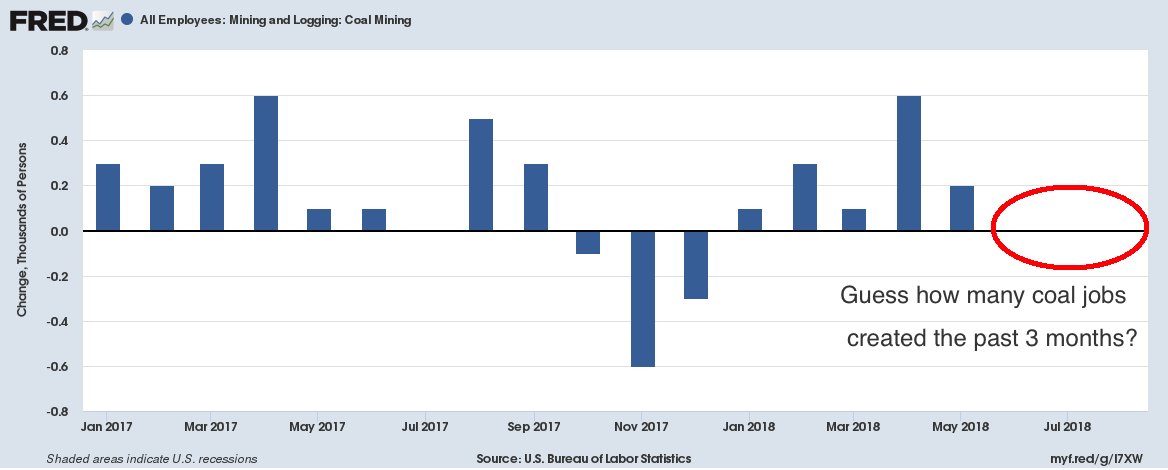
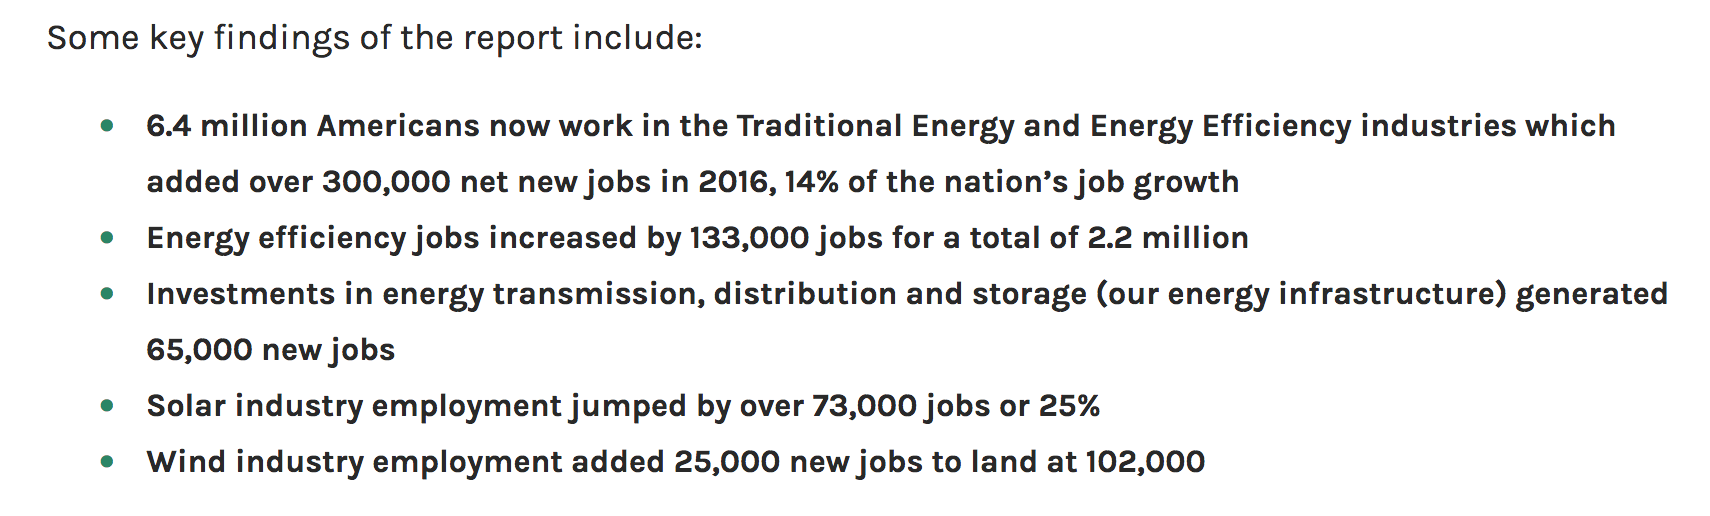
The big reveal: zero coal miners got new jobs in August; zero in July and zero in June. Specific job counts in alternative/renewable energy are not easy to come by, but this synopsis of the industry from the DoE demonstrates that we’re wasting our time trying to bring back coal.
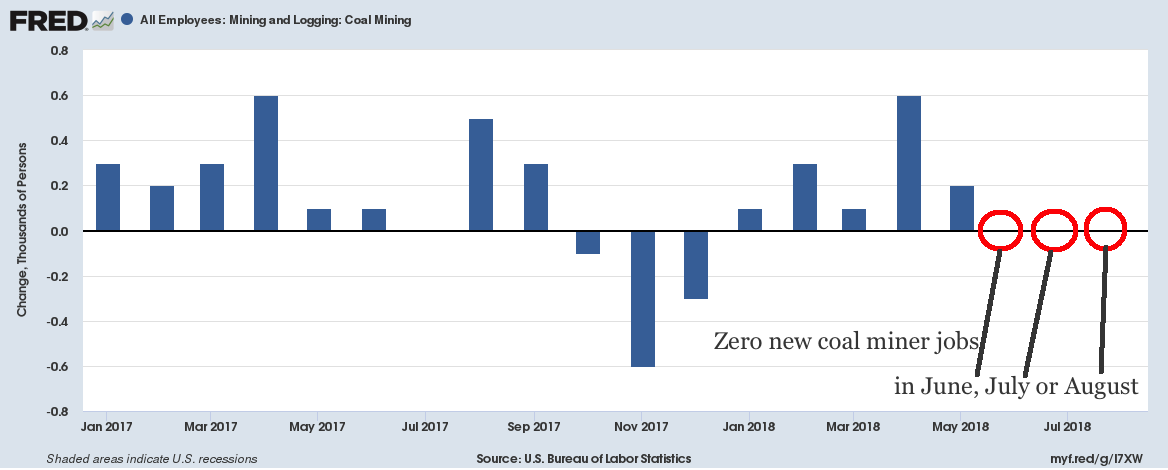
Consider that solar “jumped by over 73,000” jobs – more than the entirety of the coal mining industry, and wind added 25,000, about half of the entire coal mining industry. Not very #MAGA to continue focusing on a dying industry, is it?
~~~
@Ritholtz here: normally, the sort of thing takes place among all politicos, but this crew takes it to an exponentially higher level:
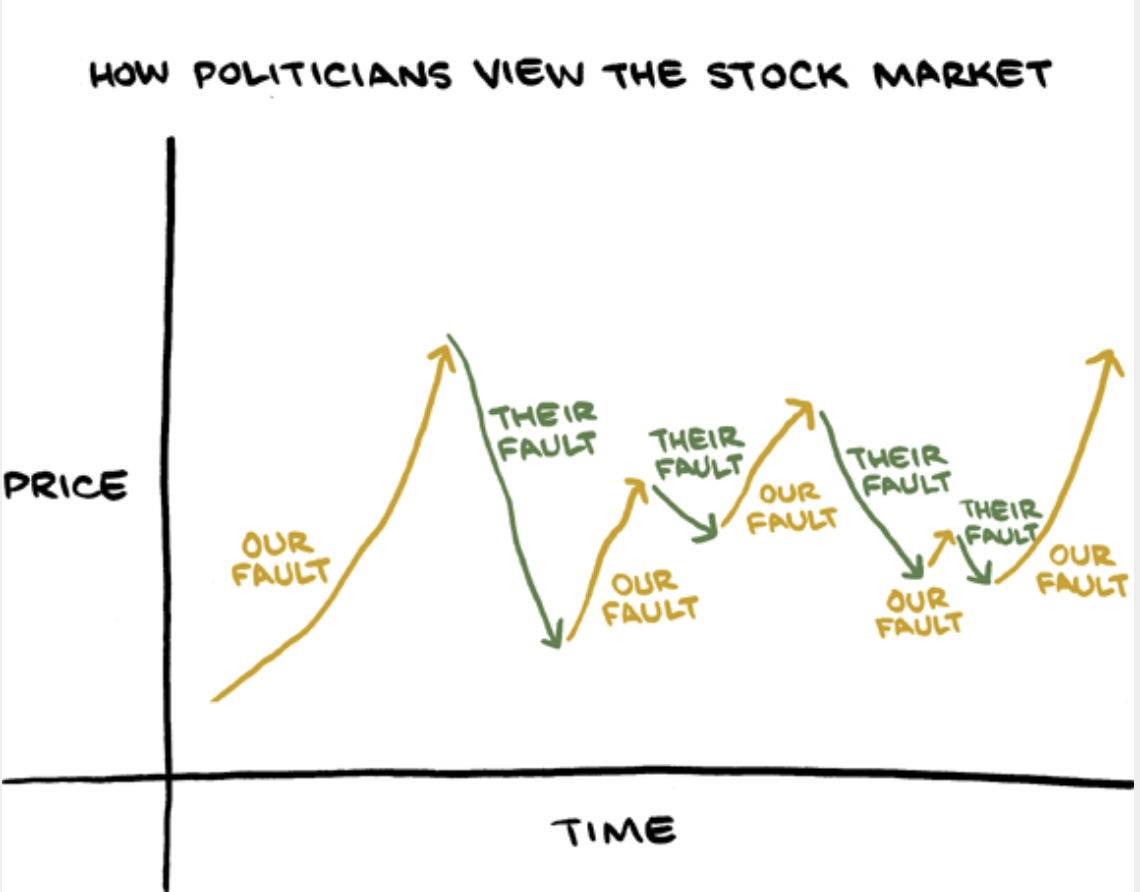
Source: SMBC
click for ginormous chart