
There is a fascinating research piece by the St. Louis Federal Reserve Bank: The Unequal Recovery: Measuring Financial Distress by ZIP Code.”
They used a clever data analysis to delve more deeply into household finances by Zip Code across different time periods, most notably since the Fed begin its current tightening cycle in 2015 – 2018.
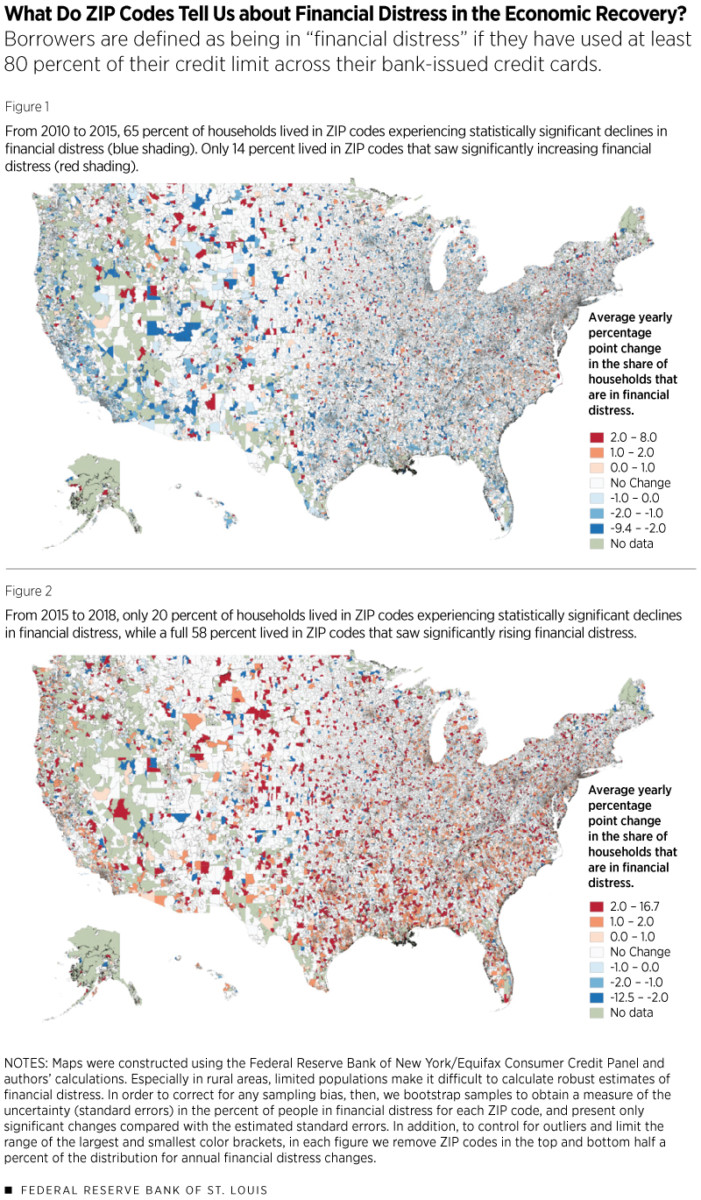
The results are that many households, even in higher valuation neighborhoods, are under financial distress. “The national trend is immediately apparent in both maps: While financial distress along our measure improved across most of the country from 2010 to 2015, it deteriorated with similar yearly magnitude from 2015 to 2018.”
More on this later . . .
Source: St Louis Fed
From the St Louis Fed:
Another way of seeing the diversity in households’ financial stability is by plotting the data geographically. Figure 1 shows the average yearly change in financial distress between 2010 and 2015, and Figure 2 does the same for 2015 and 2018. In Figure 2, for example, if a ZIP code’s shading is in the category of 1 to 2 percentage points, then the percentage of its population in financial distress increased by 3 to 6 percentage points from 2015 to 2018.
We also marked only changes that are statistically different than zero, which is why much of each map shows “no change,” especially in large rural areas with small populations.
