
Source: WSJ
File this one under more “denominator blindness:”
Every now and again, a data point comes along that seems to bother some people, when the precisely proper response should be: “So what?”
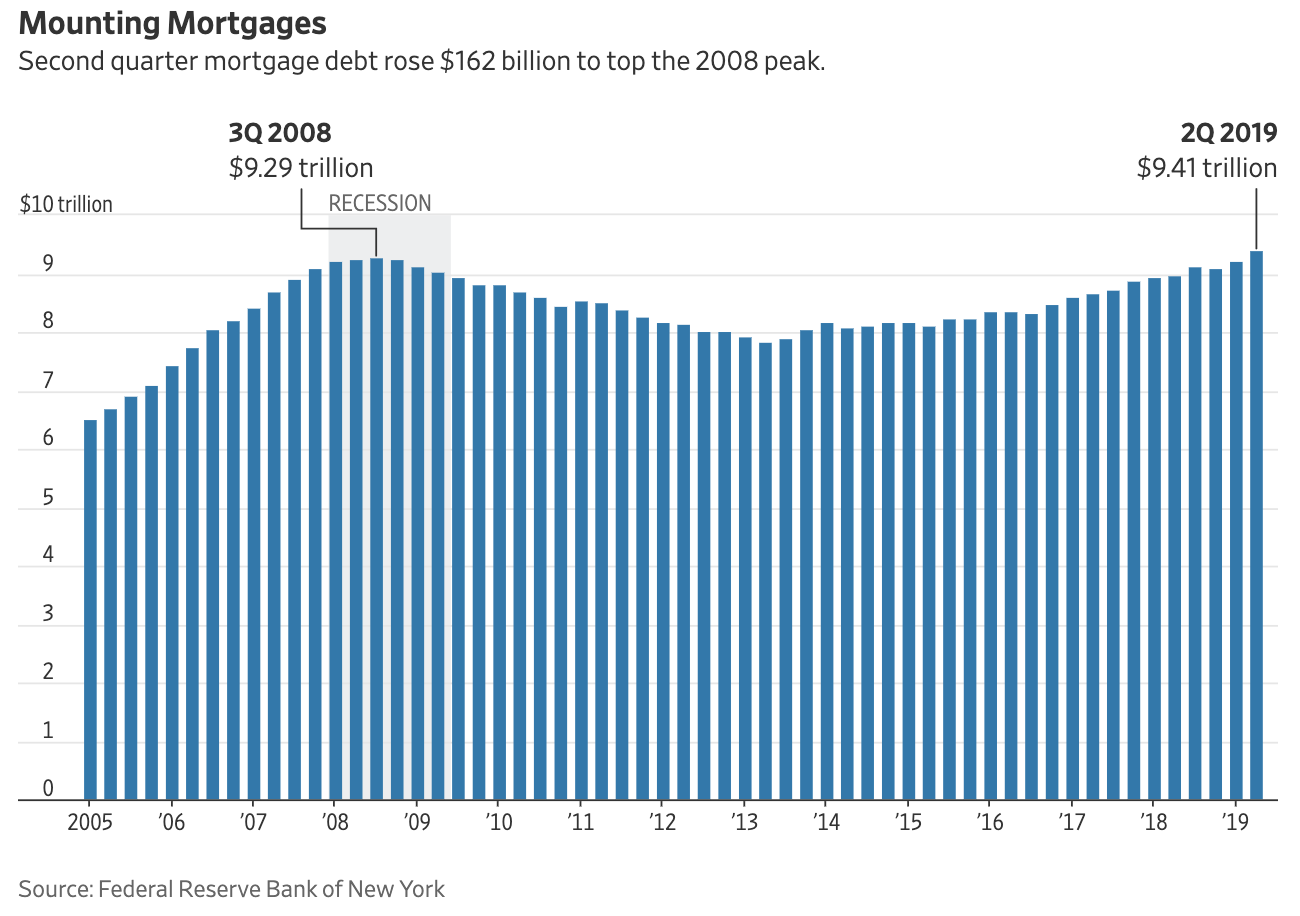
The mortgage chart above is a perfect example of a single data point out of context. Perhaps the headline — U.S. Mortgage Debt Hits Record, Eclipsing 2008 Peak — is what set some off, or the chart above. Regardless, if you just scan the headline and ignore the specifics it might lead you to draw a wrong conclusion.
Consider that headline and chart above, and then add the following context. The chart above:
-Does not reflect total number of homes or their prices;
-Does not reference debt per household;
-Does not describe lending standards or quality of loans;
-Makes no mention of how much less debt is delinquent today than the prior peak;
-Fails to reference ability of borrowers to service the debt;
-Is not inflation adjusted.
Note that $9.29 trillion in 2008 is equal on an inflation adjusted basis of about $11.07 trillion today; to eclipse 2008 peak mortgage debt in real (not nominal) dollars requires about 17% more mortgage debt than exists today.
You can create a similar “compare & contrast” with each of the other bullet points.
Let me add that the author recognized some of these issues in the column itself, which overall is accurate and balanced. The headline and chart is what gives fodder to the worst elements of the “apocalypse now” crowd, who tout that chart (and others) as a manifestation of the rerun of the 2006-09 mortgage crisis, an imminent economic demise that apparently awaits us all.
Context and nuance may not matter on social media, but it matters a great deal for investors.
Source:
U.S. Mortgage Debt Hits Record, Eclipsing 2008 Peak
By Harriet Torry
WSJ, Aug. 13, 2019
https://www.wsj.com/articles/u-s-mortgage-debt-hits-record-eclipsing-2008-peak-11565708431
