
Source: Fred
A few weeks ago, I explained why euphemisms like “Unprecedented” and “Uncertainty” are so overused as to become meaningless. These words sometimes allow is to unconsciously duck harsh truths, and tell ourselves comforting narratives.
I have discussed how the word “Uncertainty” is abused by market pundits quite often; but the word I find fascinating of late is “Unprecedented.”
Not because so much these days is unprecedented; but rather, because unprecedented things occur all the time. If the unprecedented was truly rare, we would be living in a world that operated within the prior range of occurrences, and we know that is totally untrue. Just think about how often records are set for the fastest/biggest/strongest/most expensive/longest whatevers, and you will see that the unprecedented occurs with alarming regularity.
The risk of misusing words like that is that when something truly, uniquely off-the-chart unprecedented occurs, we may miss out just how powerful it is.
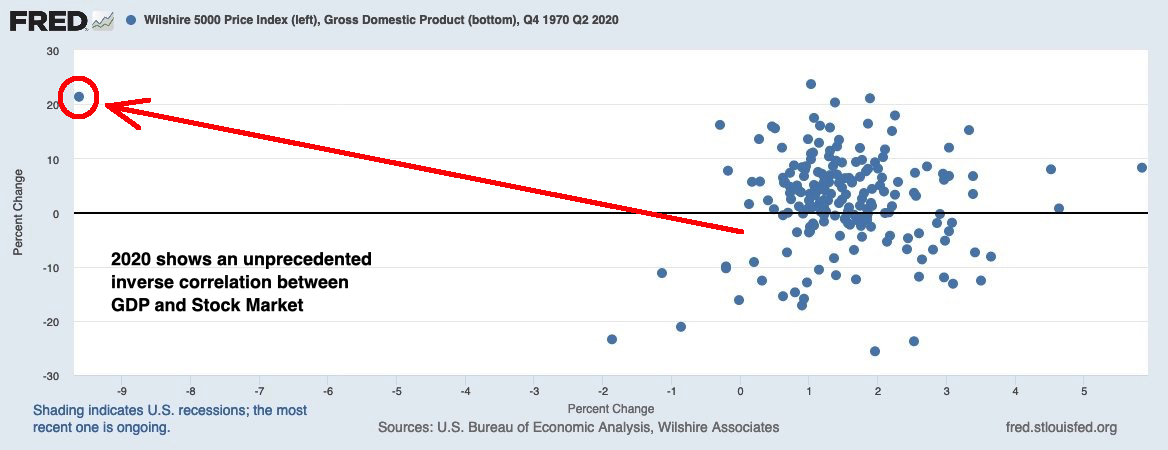
Which leads me to the chart above: Yesterday’s reads included a chart from EddyElfenbein, showing the general lack of correlation between markets and the economy (and me confirming my priors).
In an offline discussion with my alter ego, TBPInvictus, he pointed out that the chart was annual through 2019. The suggestion was made to look at it quarterly up to the present, and that chart above is his handiwork.
The unprecedented occurs all the time, but if you want to see something that is orders of magnitude off the scale of the usual non-correlation between stocks and the economy, that inverse correlation is really something else.
Man, Q2 2020 is the outlier of all outliers.
Previously:
Unprecedented Uncertainty (June 9, 2020)
Off the Charts (July 31, 2020)
“Uncertainty” Meme Refuses to Die… (May 20, 2016)
Kiss Your Assets Goodbye When Certainty Reigns (November 9, 2010)
