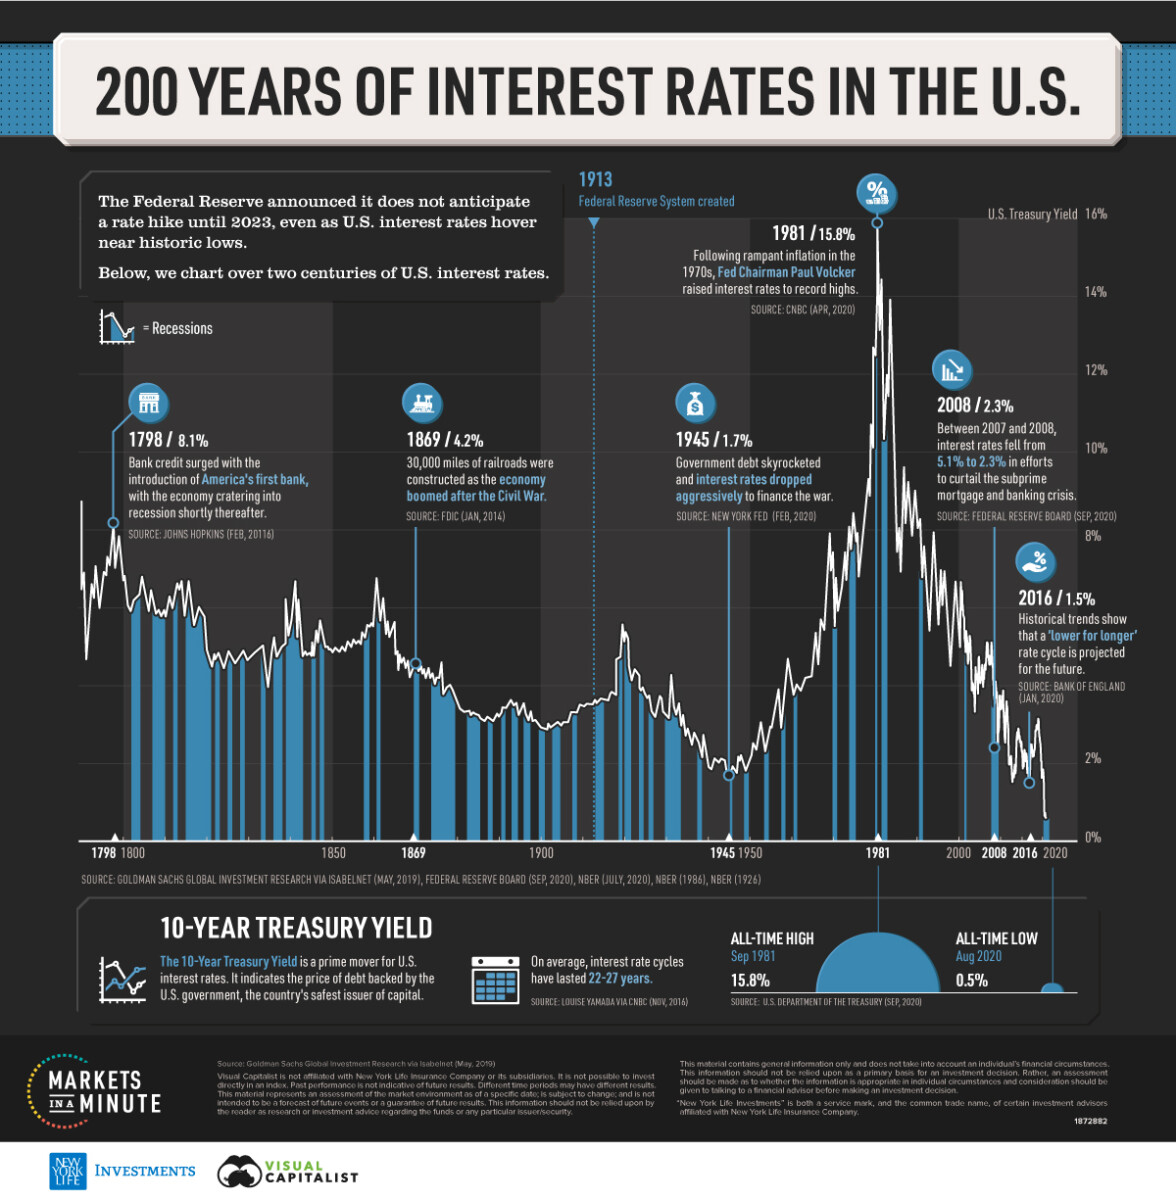
Source: Visual Capitalist
I am out of pocket most of today, but I wanted to share a quick note on the long-term history of Interest rates, as seen in the above history.
Three things stand out :
1) From 1790 to 1950, the overall trend was towards lower rates.
2) The 1970s-80s inflation/yield spike was historically aberrational.
3) 2009-present zero interest rate regime is utterly unprecedented .
Just because something has not happened before does not mean it won’t happen. The “Unprecedented” occurs all the time.
Here is Visual Capitalist‘s take:
What are the highest and lowest rates throughout history?
Prior to today’s historically low levels, interest rates fell to 1.7% during World War II as the U.S. government injected billions into the economy to help finance the war. Around the same time, government debt ballooned to over 100% of GDP.
Fast-forward to 1981, when interest rates hit all-time highs of 15.8%. Rampant inflation was the key economic issue in the 1970s and early 1980s, and Federal Reserve Chairman Paul Volcker instigated rate controls to restrain demand. It was a period of low economic growth and rising unemployment, with jobless figures as high as 8%.
The 30,000 foot view gives a unique perspective…
Previously:
Unprecedented Uncertainty (June 9, 2020)
Unprecedented Inverse Correlation (September 1, 2020)

