
S&P 500 CAPE ratio now above 1929 levels for the only time apart from 1998-2001
Source: Jim Reid, Deutsche Bank
One of the things that market analysts love to do is to compare recent market action with some prior historical era, and declare “The market today is just like ____.” Recall the 1987 parallels a few years ago or the more recent 1929 versions.
These parallels can be based on absolute price, a chart pattern, number of consecutive up (or down) days, valuations based on P/E or P/S or P/B, the number of 1 or 2% days in a given period, or whatever. They come in both bullish or bearish guises, often rife with undeserved confidence.
You probably have been seeing a lot of these over the past few years, even more lately. I notice a few commonalities to many of them: They tend to focus on a single variable; they oversimplify the complexities of markets or the economy; and they usually buck the dominant market trend.
More recently, I have been seeing a variation of this phenomenon using Shiller’s CAPE. I have for a long time been unconvinced that the CAPE ratio is a significant indicator for making buy or sell decisions. It more likely provides a range of future return expectations. I remain both unconvinced and curious.
So when I read this balanced, intelligent analysis from Jim Reid of Deutsche Bank, I took notice. It notes both the recent record highs since 1929, and why they might not mean what some claim that extreme mark suggests:
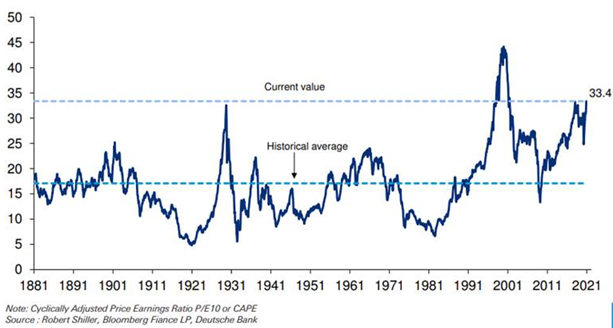
“One chart that I’ve used in various forms ever since I read “Irrational Exuberance” by Robert J. Shiller back in March 2000 is the S&P 500 CAPE ratio of the S&P 500. This is the cyclically adjusted P/E by looking at 10 years of earnings not the current. The chart is a regular in my chart book and with [December 1st’s close], this CAPE ratio has now climbed to its highest ever level outside of the 2000 bubble period. Indeed with that we have gone above the level seen on the eve of the 1929 stock market crash and the recent peak in January 2018.
We have 1679 monthly observations back to 1881 and the CAPE was higher than current for 38 months between early 1998 to early 2001. Outside of this it’s never been higher than where it is today.
The CAPE ratio is not perfect for many reasons and note we’ve been above the long-term average of 17 since early 1991 outside of 10 months during the GFC. So if this ratio does mean revert (which it probably does) it can take a lifetime of investing and structural shifts to do so in both directions. The most used justification for current structural higher CAPE than long-term averages is the four decade decline in yields to what are now close to all time multi-century lows.
So there is clear reason why these numbers are elevated. However, how elevated they should be is a bigger discussion especially as we’ve now gone past September 1929 peak levels and we currently have the largest stocks influencing the index in a way they probably never have before. I personally think the path of those 10 mega-cap stocks, which have further benefited from the pandemic, could be the most interesting thing to watch in 2021.
I like the framework of pointing out a metric at an extreme, calmly explaining why its not a “hair on fire” moment, then explaining why it should engender a “bigger discussion.”
To add some related thoughts to this conclusion:
1. Stocks are not cheap,
2. But that doesn’t mean they won’t run further;
3. Numerous data points are at levels today that are not parallel to 1929;
4. A Federal stimulus would be positive for the economy;
5. Covid vaccine distribution suggest the economy can begin to normalize in 2 or 3 quarters;
6. But much of that stimulus [4 & 5] might already be priced into markets;
7. Rates are so low, there is not much in the way of alternatives;
8. The market crash was a great reset, and should start off the next leg of the secular bull market that began in 2013.
YMMV.
Previously:
When Correlations Lie (June 27, 2014)
Pros & Cons of Shiller’s CAPE (August 25, 2014)
Single vs. Multiple Variable Analysis in Market Forecasts (May 4, 2005)
click for audio
