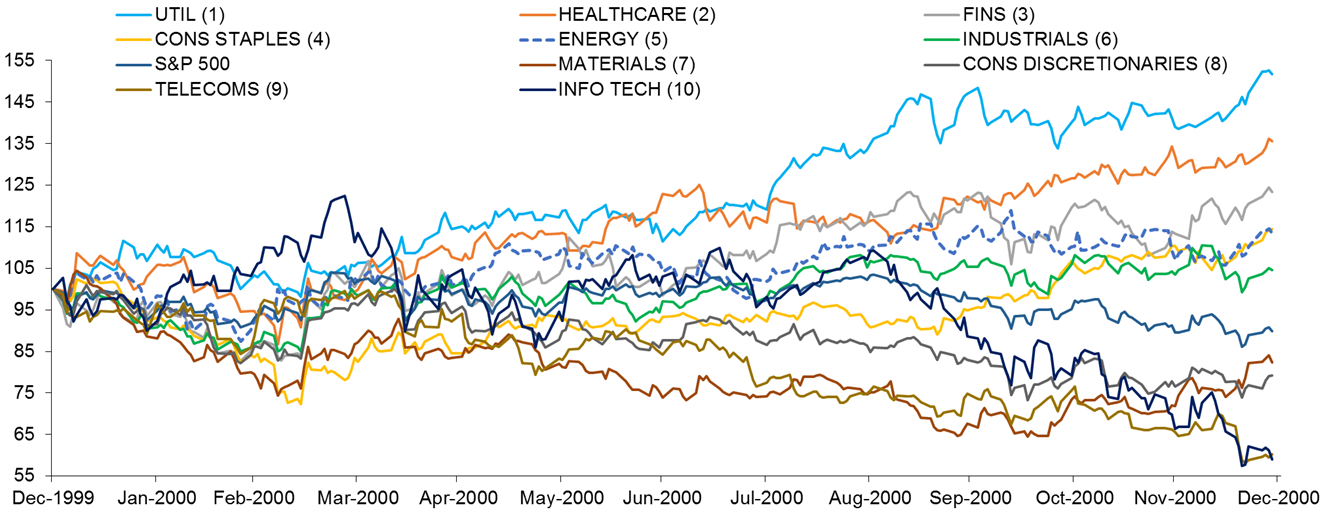
The Spectacular Tech Bubble Burst in March 2000

Source: Deutsche Bank
To hear an audio spoken word version of this post, click here.
Investor sentiment tends towards reactions and overreactions to whatever just happened.
Since the Covid Crash last year, the big move off of the lows in the S&P500 Index, the giant moves in Nasdaq/Technology + a combination of Bitcoin’s monster gains + the new Non-fungible token craze has people seeing bubbles everywhere.
Over the years I have learned to be self-aware of that first knee jerk response to any trade idea. If your first reaction to anything is “UGH, Hard Pass” ask yourself how much of the crowd had the exact same reaction. This applies to turnaround stocks as collective emotions carry prices too low; I wonder if it applies to novel products or new asset classes because of a fear of the new and unknown.
Regardless, a lot of the present sentiment is courtesy of the move off of the lows to new market highs. The current run up has people swearing these gains over the past 12 months are a sure sign of a bubble. Jim Reid of Deutsche Bank reported a recent survey showing 90% of respondents believing US Tech and Bitcoin were both in a bubble.
I am less sure about that: Perhaps some context can help explain why the crowd seems to sees bubbles everywhere it looks:
S&P 500 index notched a 74.8% gain a huge 12-month performance.7
But that lacks all context, and measures off of the lows.
Consider the preceding 13 months instead: Over that period, the S&P 500 is up a mere 17.2%.
What a difference 1 month makes: Dates & context matter! pic.twitter.com/4qHk0dNN2m
— Barry Ritholtz (@ritholtz) March 24, 2021
The fastest 30% drop and fastest recovery create some anomalies in markets. Depending upon the time horizon you cherry pick, we have either rocketed up 75% over 12 months or had a pretty good 17% move higher over 13 months.
75% versus 17%.
What sort of month was that difference? About a down 34% month — March 2020.
It is also worth noting that not all sectors in the market move in lockstep. This is true when markets top, as the 2000 era chart above shows. Reid points out:
“The spectacular tech bubble burst in March 2000 and by YE had lost more than half its peak value. However although the S&P 500 fell around -10% in 2000, six of the ten headline sectors were higher over the course of the year with Utilities (+51.7%), Healthcare (+35.5%) and Financials (+23.4%) leading the way.
Indeed at the frothy market peak at the end of March only two non-tech sectors were up for the year. So before the bubble peaked there had been a move away from the old economy into tech and when the tech bubble burst there was a huge rotation back into the old economy, even if the overall index traded lower with an associated telecom sector slump not helping.”
The key observation here is that behavior among different sectors changes at tops, bottoms and middles. That is true for markets, and it is true for economic cycles as well.
For those who see bubbles, I suggest consider the possibility of a rotation. As the Covid-19 induced recession comes to an end, and the recovery post-pandemic ramps up, we are also seeing a rotation out of some sectors (Tech, Pharma) and into others (Energy, Financials, Travel). This makes sense when you consider how concentrated the gains were during the lockdown. The rotation away from lockdown stocks and towards economic re-opening stocks makes sense.
Context matters.

