
Last week, Rosie and I had long online panel discussion about, well, everything: Bubbles and bull markets, real estate and gold, optimism and technology. I will link to the video if it ever goes on line, but it was 90 juicy minutes of us debating why sentiment measures are mostly silly, and why the traditional definitions of bull & bear markets, corrections and pullbacks are utter nonsense.
Anyway, I wanted to track down someone else who dates the new bull market to 2013 — and it turned out to be Stephen Suttmeier, someone from Rosie’s former shop, Merrill Lynch (now BAML).
This is about as much as I can share without running afoul of copyright, but if you have a connection to BAML, you can ask for the full report.
With the benefit of hindsight, we can see that Suttmeier got it dead right…
~~~
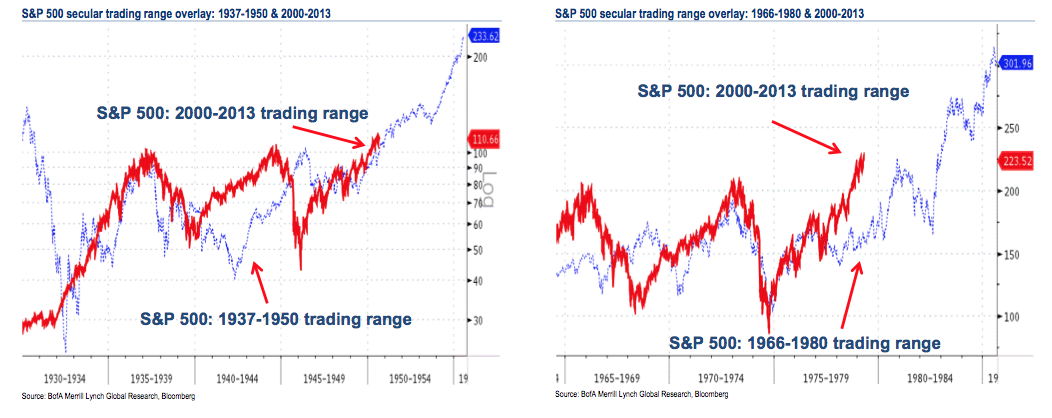
Secular bull market roadmap: A 1950s style breakout
Based on the 1937 to 1950 secular trading range, the S&P 500 is breaking out from its 2000 to 2013 secular trading range right on schedule.
But watch for a 1982-style moment
Based on the 1966 to 1980 trading range for the S&P 500, the 2013 breakout from the 2000 to 2013 trading range is early. As the US equity market emerges from longer-term trading range into secular bull market, the bears typically have a parting shot. The pullback into mid 1982 was such a parting shot by the bears.
Click to enlarge
Source:
Stephen Suttmeier, MacNeil Curry, Jue Xiong
Monthly chart portfolio of global markets
Bank of America Merrill Lynch, October 1, 2013
