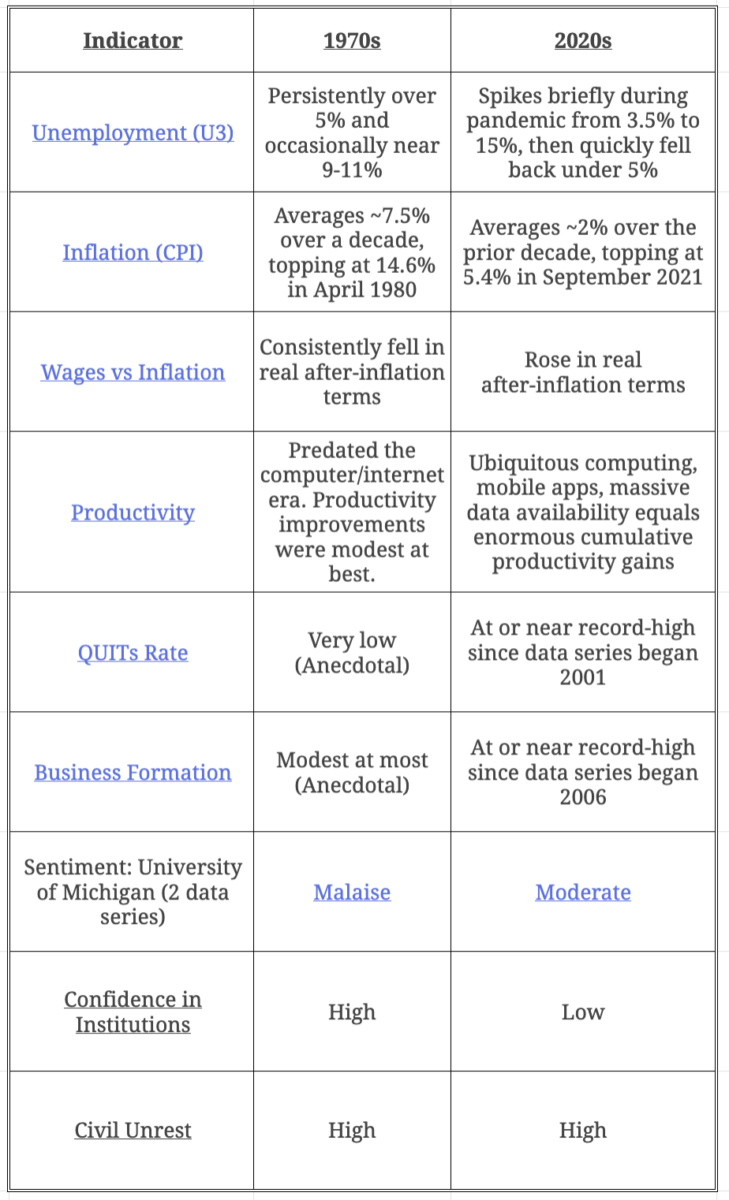
Yesterday, we compared the economic circumstances between the current 2020-21 situation with the economy of the 1970s in Stagflation LOL. For each bullet point in our table, I linked to a FRED chart (or another source where relevant).
I received more than a few requests to assemble all of the charts all in one place, and so you will find them all below.
Normally, I am not a fan of amassing a huge run of charts — it looks like an attempt to overwhelm the readers’ sensibilities or an exercise in confirmation bias. However, for our purposes of comparing the present day with the 1970s, any one of these charts can be reviewed by itself, or in concert with the others. They are a broad assortment of economic data directly related to inflation, wages, and employment.
In my opinion, these reveal a huge difference between the present decade and the decade half a century ago…
Click on charts for full-size version; sources for all can be found here.
Real Wages: Average Hourly Earnings versus CPI Inflation

Misery Index
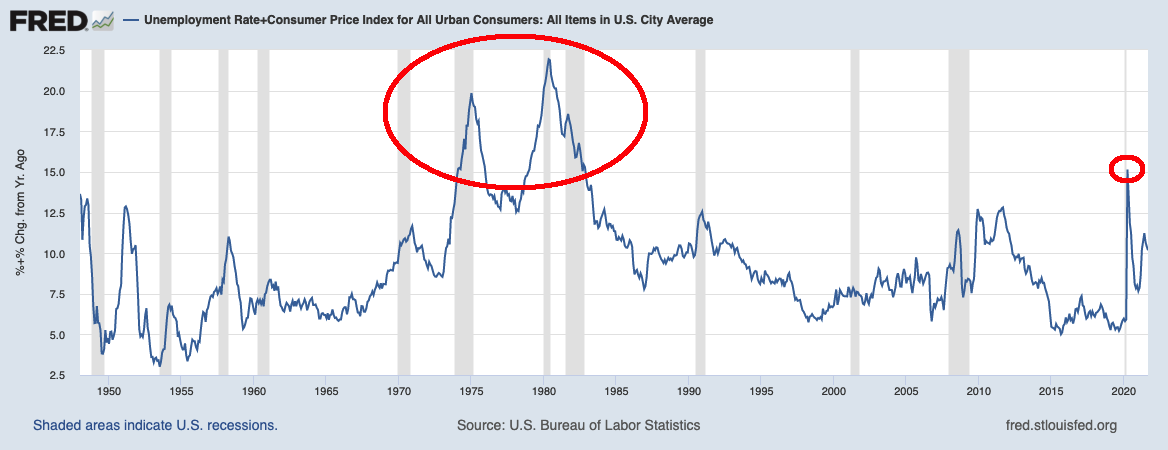
Misery Index Component 1: Unemployment (U3)

Misery Index Component 2: CPI Inflation

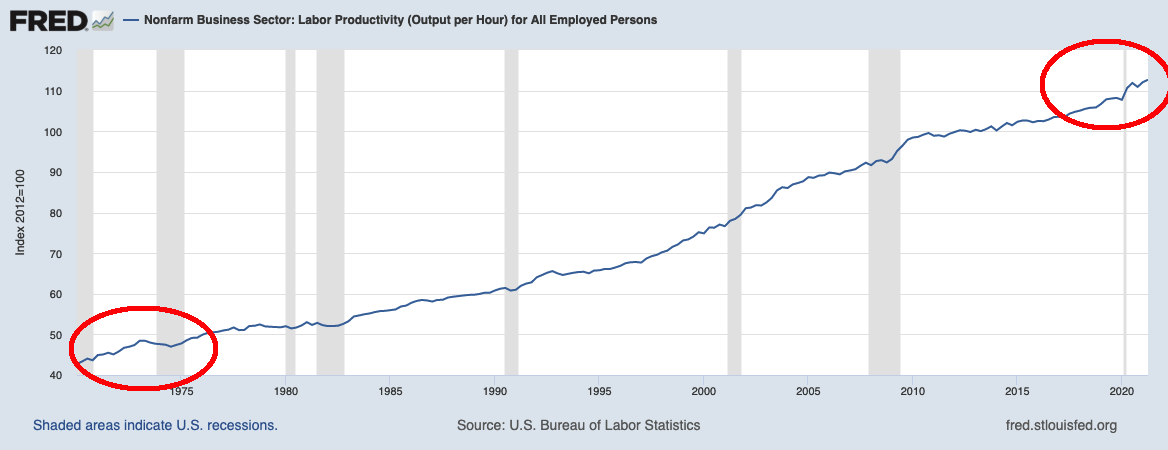
Productivity
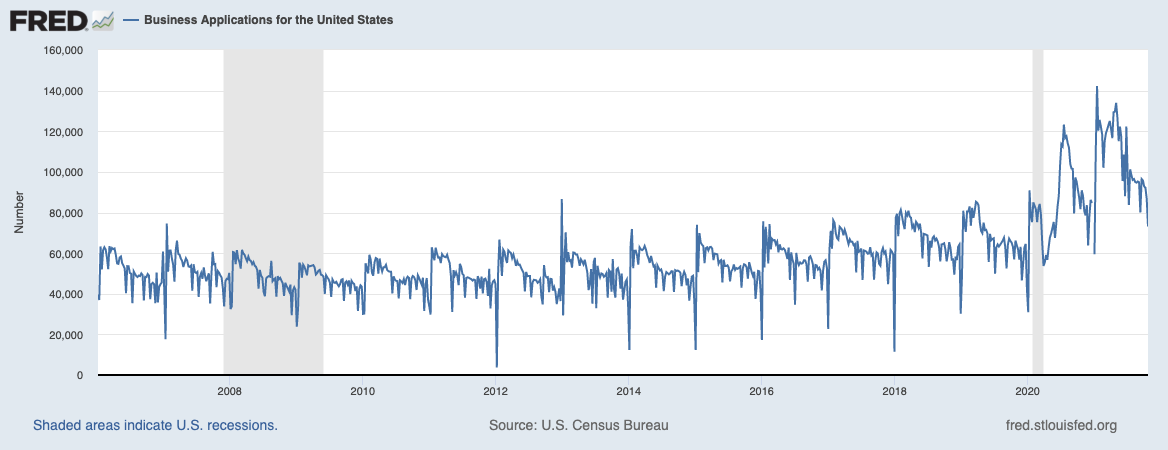
New Business Formation
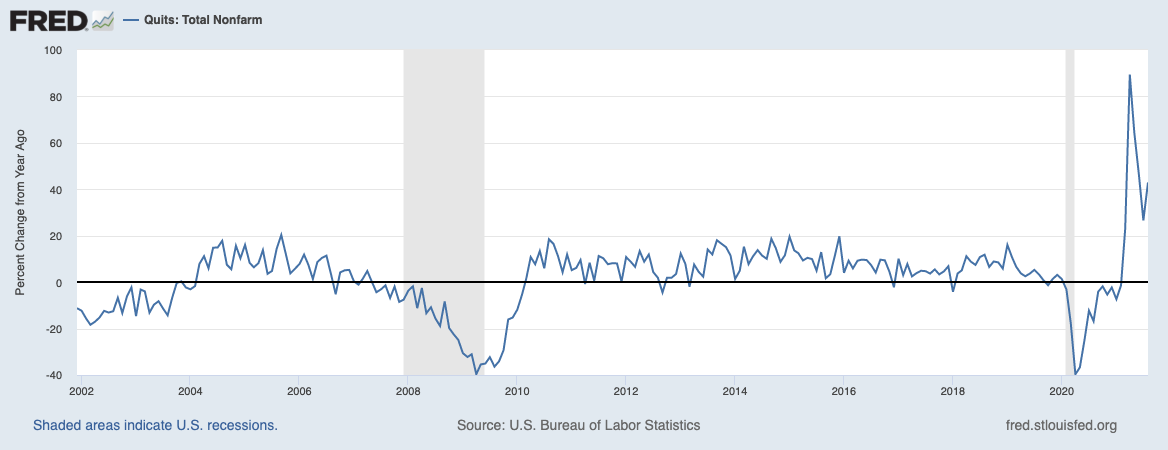
Quits Rate
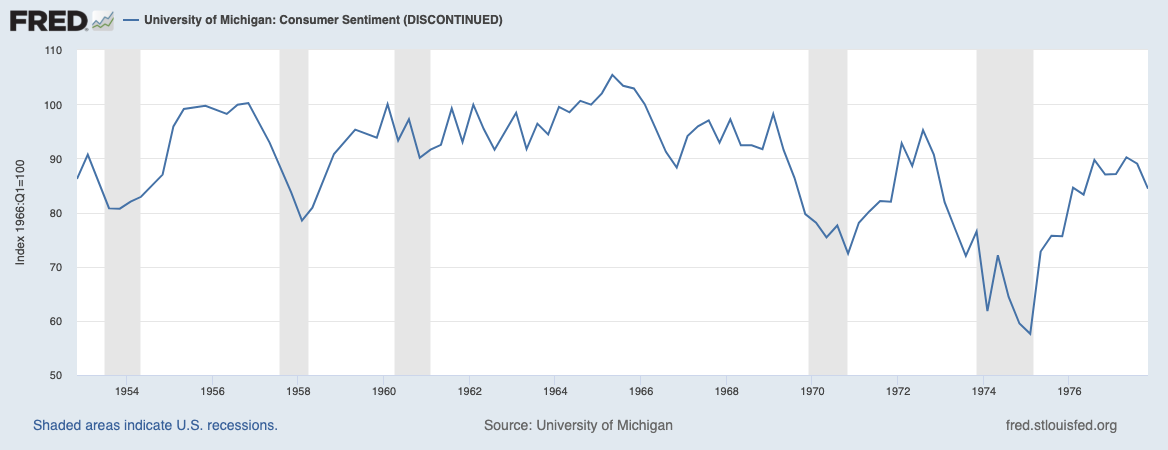
University of Michigan Consumer Sentiment (data series 1952-77 and 1978-present)

Previously:
Stagflation LOL (November 1, 2021)