
To hear an audio spoken word version of this post, click here.
“Stagflation Is All Anyone in Markets Wants to Talk About Now”
–Bloomberg News, October 12, 2021“Summer of Stagflation: White House policy mix has yielded slower growth but higher prices.” –WSJ, October 28, 2021
I am genuinely perplexed every time I hear someone compare the current circumstances of employment and prices to the stagflation era of the 1970s. It pops up occasionally, the most recent version was when we were heading into the 2008-09 GFC. It is a sporadic, all too regular occurrence, serving to remind us that the past is less well understood than you imagined.
“Stagflation” is a portmanteau of “inflation” and “stagnation.” It traces its roots to 1965 when House of Commons member Iain Macleod coined the term. Macleod, who would go on to become Chancellor of the Exchequer in 1970, observed:
“We now have the worst of both worlds—not just inflation on the one side or stagnation on the other, but both of them together. We have a sort of ‘stagflation‘ situation. And history, in modern terms, is indeed being made.”
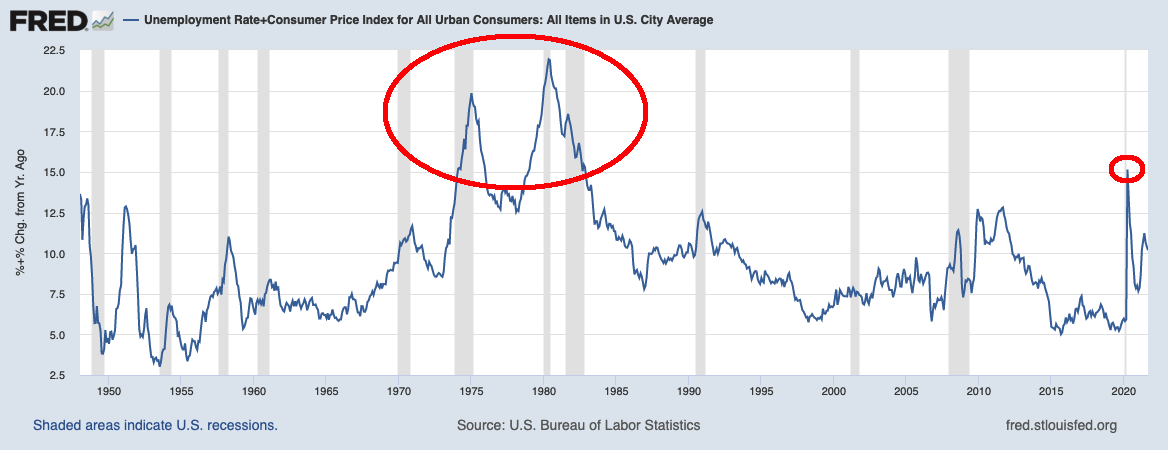
Debates about how much of each (inflation + stagnation) were needed for stagflation went unresolved until Arthur Okun of the Brookings Institution decided to combine Inflation (CPI) and Unemployment (U3) in a single table (and chart).1 Okun had created the Misery Index, which gave us a simple way to visualize the state of the economy.
You can see how this manifested on the chart above: It shows just how unique of an era the 1970s were, with high inflation and unemployment lasting a full decade. The stagflation combination of 9-10% unemployment and 12-15% inflation was more than inconvenient — it potentially signaled the end of the post-war era of growth and prosperity. It was used to devastating effect against the incumbent in the White House — twice.2
As noted, the Misery Index spent a decade averaging well over 15; In 2020, it was over 15 for a hot minute before falling back to where it is now between 10-11 — about half of the 1970s-80 peak.
Consider these differences between the present era and the 1970s (Charts here):
| Indicator | 1970s | 2020s |
| Unemployment (U3) | Persistently over 5% and occasionally near 9-11% | Spikes briefly during pandemic from 3.5% to 15%, then quickly fell back under 5% |
| Inflation (CPI) | Averages ~7.5% over a decade, topping at 14.6% in April 1980 | Averages ~2% over the prior decade, topping at 5.4% in September 2021 |
| Wages vs Inflation | Consistently fell in real after-inflation terms | Rose in real after-inflation terms |
| Productivity | Predated the computer/internet era. Productivity improvements were modest at best. | Ubiquitous computing, mobile apps, massive data availability equals enormous cumulative productivity gains |
| QUITs Rate | Very low (Anecdotal) | At or near record-high since data series began 2001 |
| Business Formation | Modest at most (Anecdotal) | At or near record-high since data series began 2006 |
| Sentiment: University of Michigan (2 data series) | Malaise | Moderate |
| Confidence in Institutions | High | Low |
| Civil Unrest | High | High |
Whenever I see a pundit discussing stagflation on TV these days, it is very obvious whether or not they have done the deep dive into the data that underlies the 1970s era of stagflation.3
Comparing the two eras is an exercise in differences, not similarities…
Previously:
Why This Isn’t Stagflation (April 18, 2007)
Quote of the day: Stagflation & the 1970s (February 22, 2008)
Misery Index Over Presidential Terms (February 29, 2016)
____________
1. In addition to being the creator of the misery index, he also created Okun’s law: “For every 1% increase in the unemployment rate, a country’s GDP will be roughly 2% lower than its potential GDP.” Full bio here.
2. It was used by Jimmy Carter against Gerald Ford to great effect in the 1976 election; 4 years later, Ronald Reagan borrowed the idea and pummelled Carter with it.
3. Note this isn’t the first time, this group has cried wolf over stagflation — it is a seasonal occurrence (see chart below), including a giant spike heading into the 2008-09 crisis.
Stagflation searches, United States, 2004 – Present
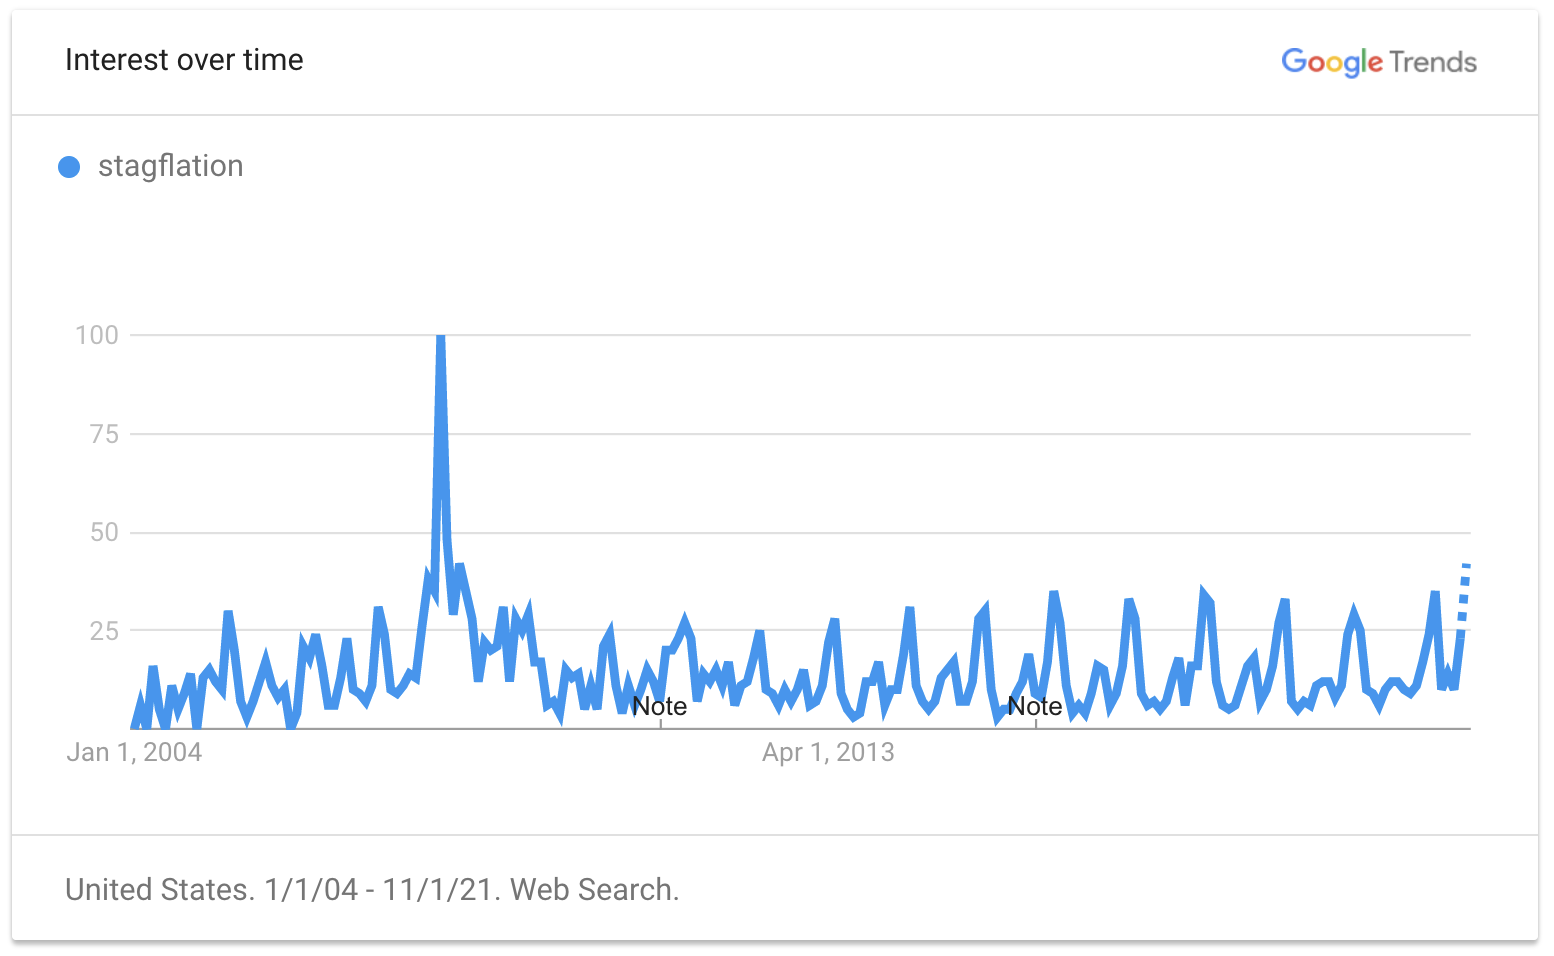
Source: Google Trends
click for audio
