
Claims that the top 5 or 10 stocks are the sole or primary drivers of markets do not hold up to close scrutiny.
We discussed this yesterday, using both the Equal Weight S&P500 Index as well as sector performance to show this is a broad and healthy rally.
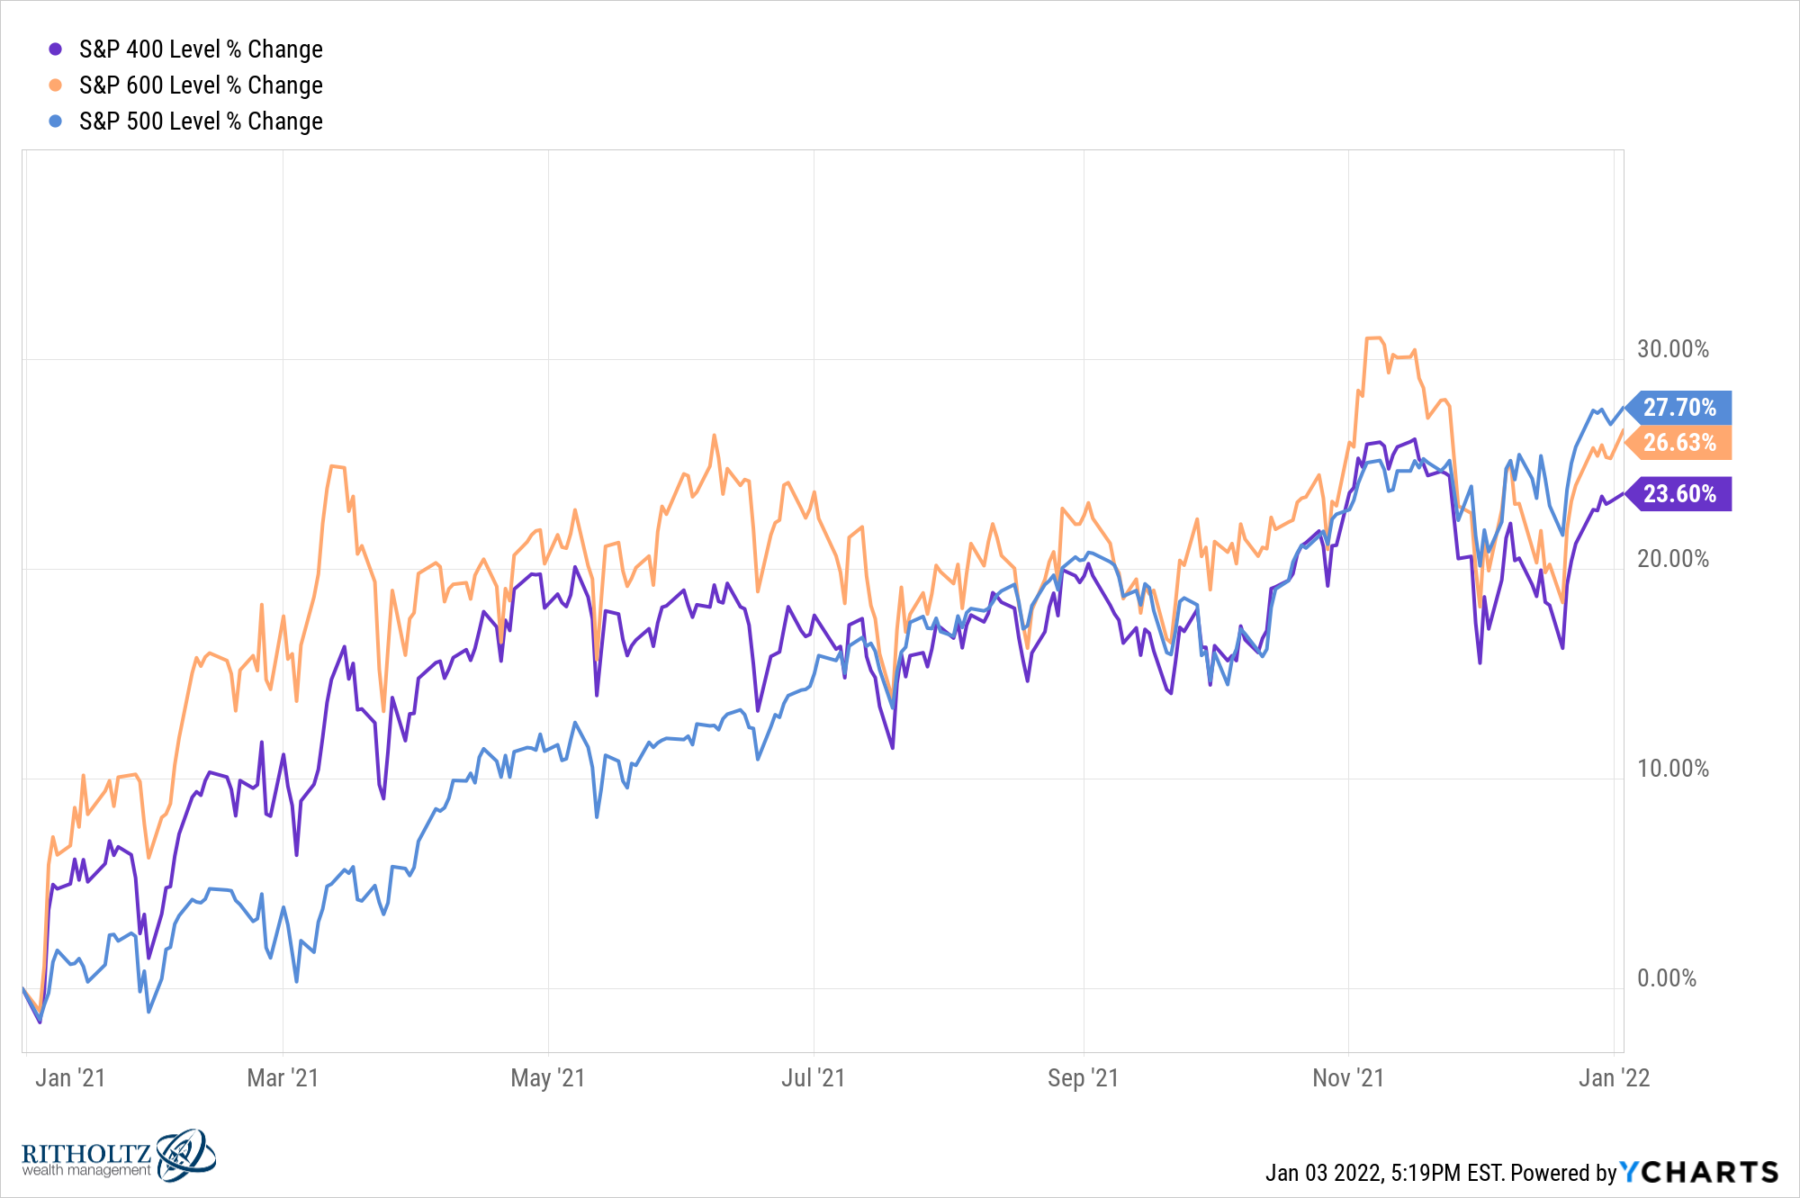
That post generated some pushback. And so I want to try a different tack: Comparing the S&P600 Small Cap, S&P400 midcap, S&P500 Large Cap performance for 2021.
The S&P500 index beat the S&P600 Small Caps, but barely: 27.7% vs 26.6%. That is not the sort of wild underperformance you expect to see from a narrow, top-driven market. Ironically, it was the midcaps that did the least well at 23.6%. Note: Almost 24% would usually be considered a great year, but in 2021, it was the laggard.
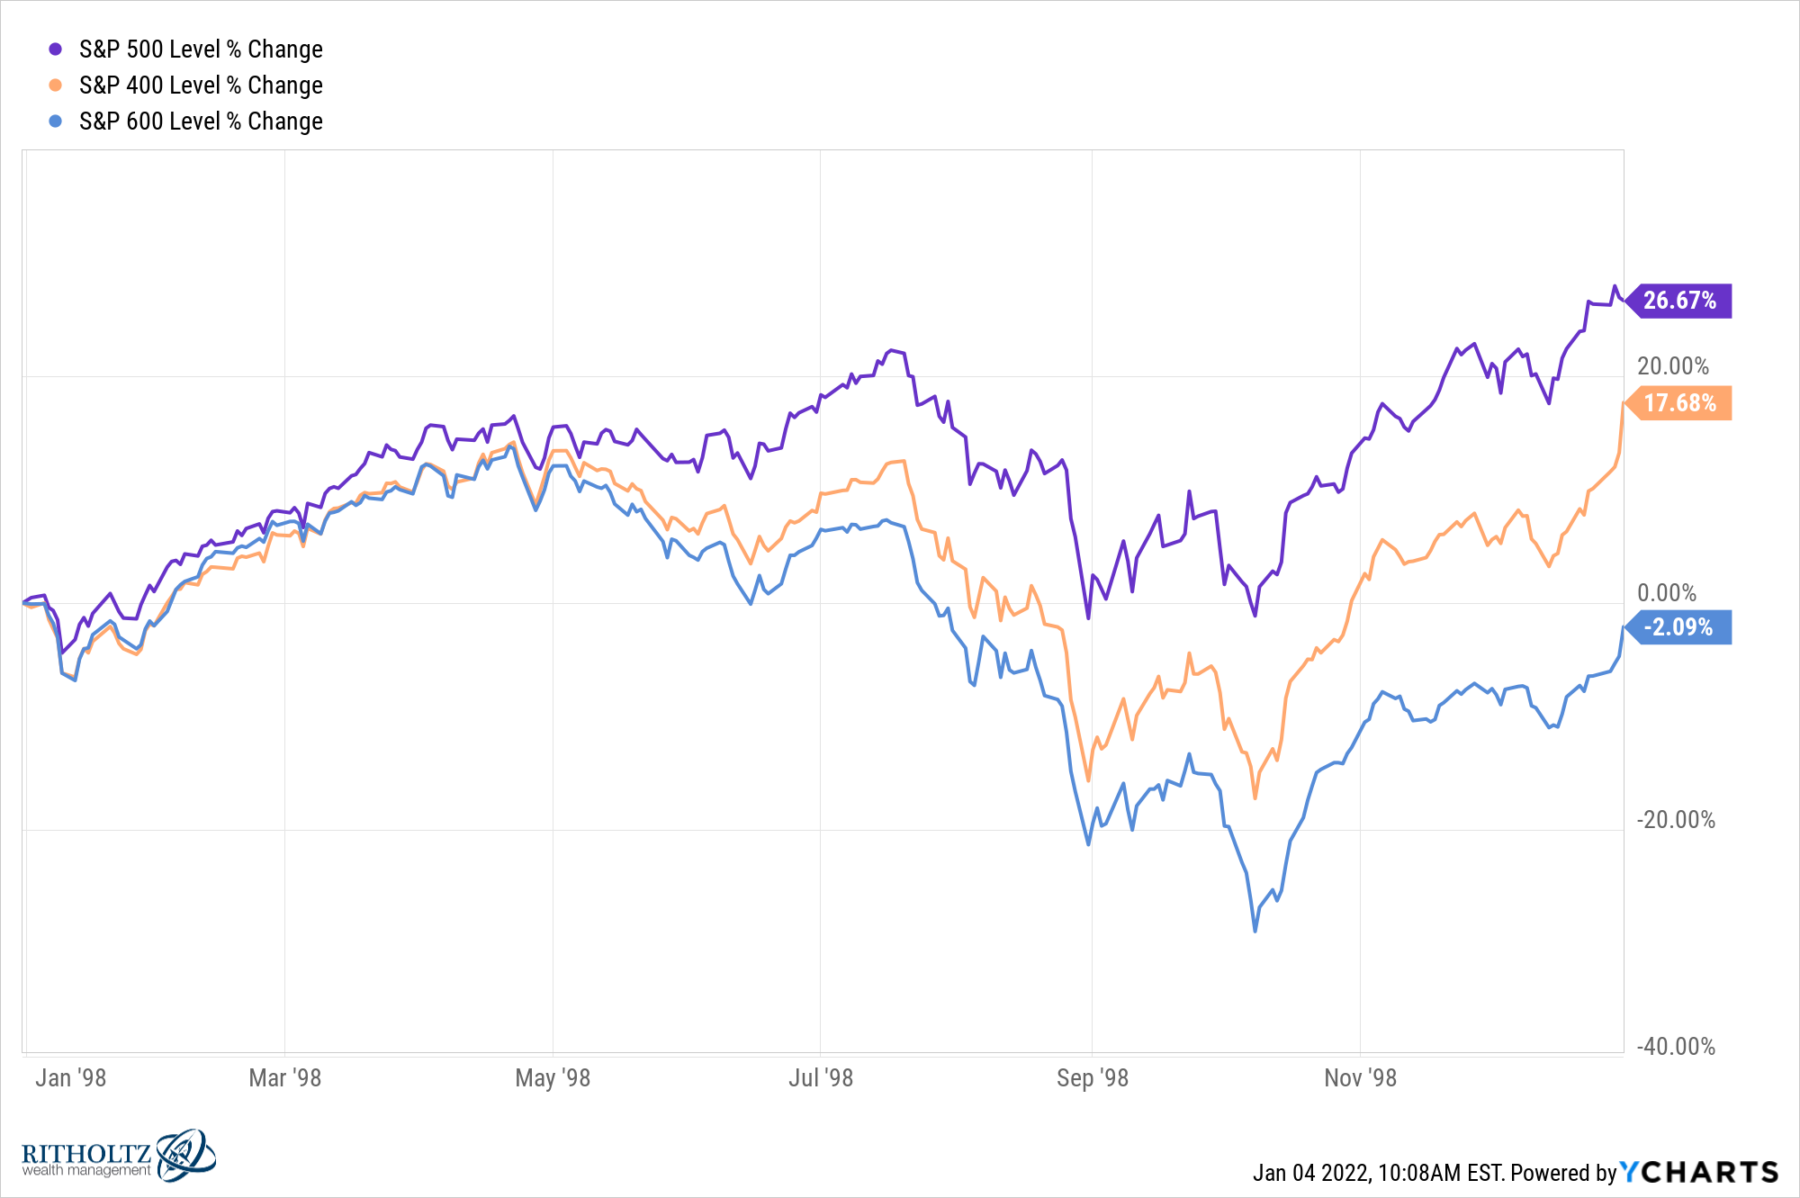
If you want to see a (cherry-picked) example of a narrow market where big caps outperformed small caps, see 1998: The S&P 500 saw gains of 26.7% (quite similar to 2021), but the small-cap S&P 600 actually lost 2.14%. THAT was a narrow market:
That chart (at top) tells a story of a market that is broad, not narrow.
Previously:
What Does Equal Weight S&P500 Say About Top 5 Stocks? (January 3, 2022)
