To hear an audio spoken word version of this post, click here.
I keep hearing how much the stock market is driven by its top 5 stocks. Flip on the TV, check out Financial Twitter, or read any media, it’s all some people want to discuss. There have been endless digressions about this: Why it is so dangerous and how it all ends very badly
Spoiler: Every bull market eventually ends badly.
But I rarely see convincing data to back up the claims that just 5 companies — Apple, Amazon, Google, Facebook, and Microsoft — are what is driving the entire stock market.
A simple test helps answer this question: How has the rest of the S&P 500 index performed relative to that cap-weighted index?
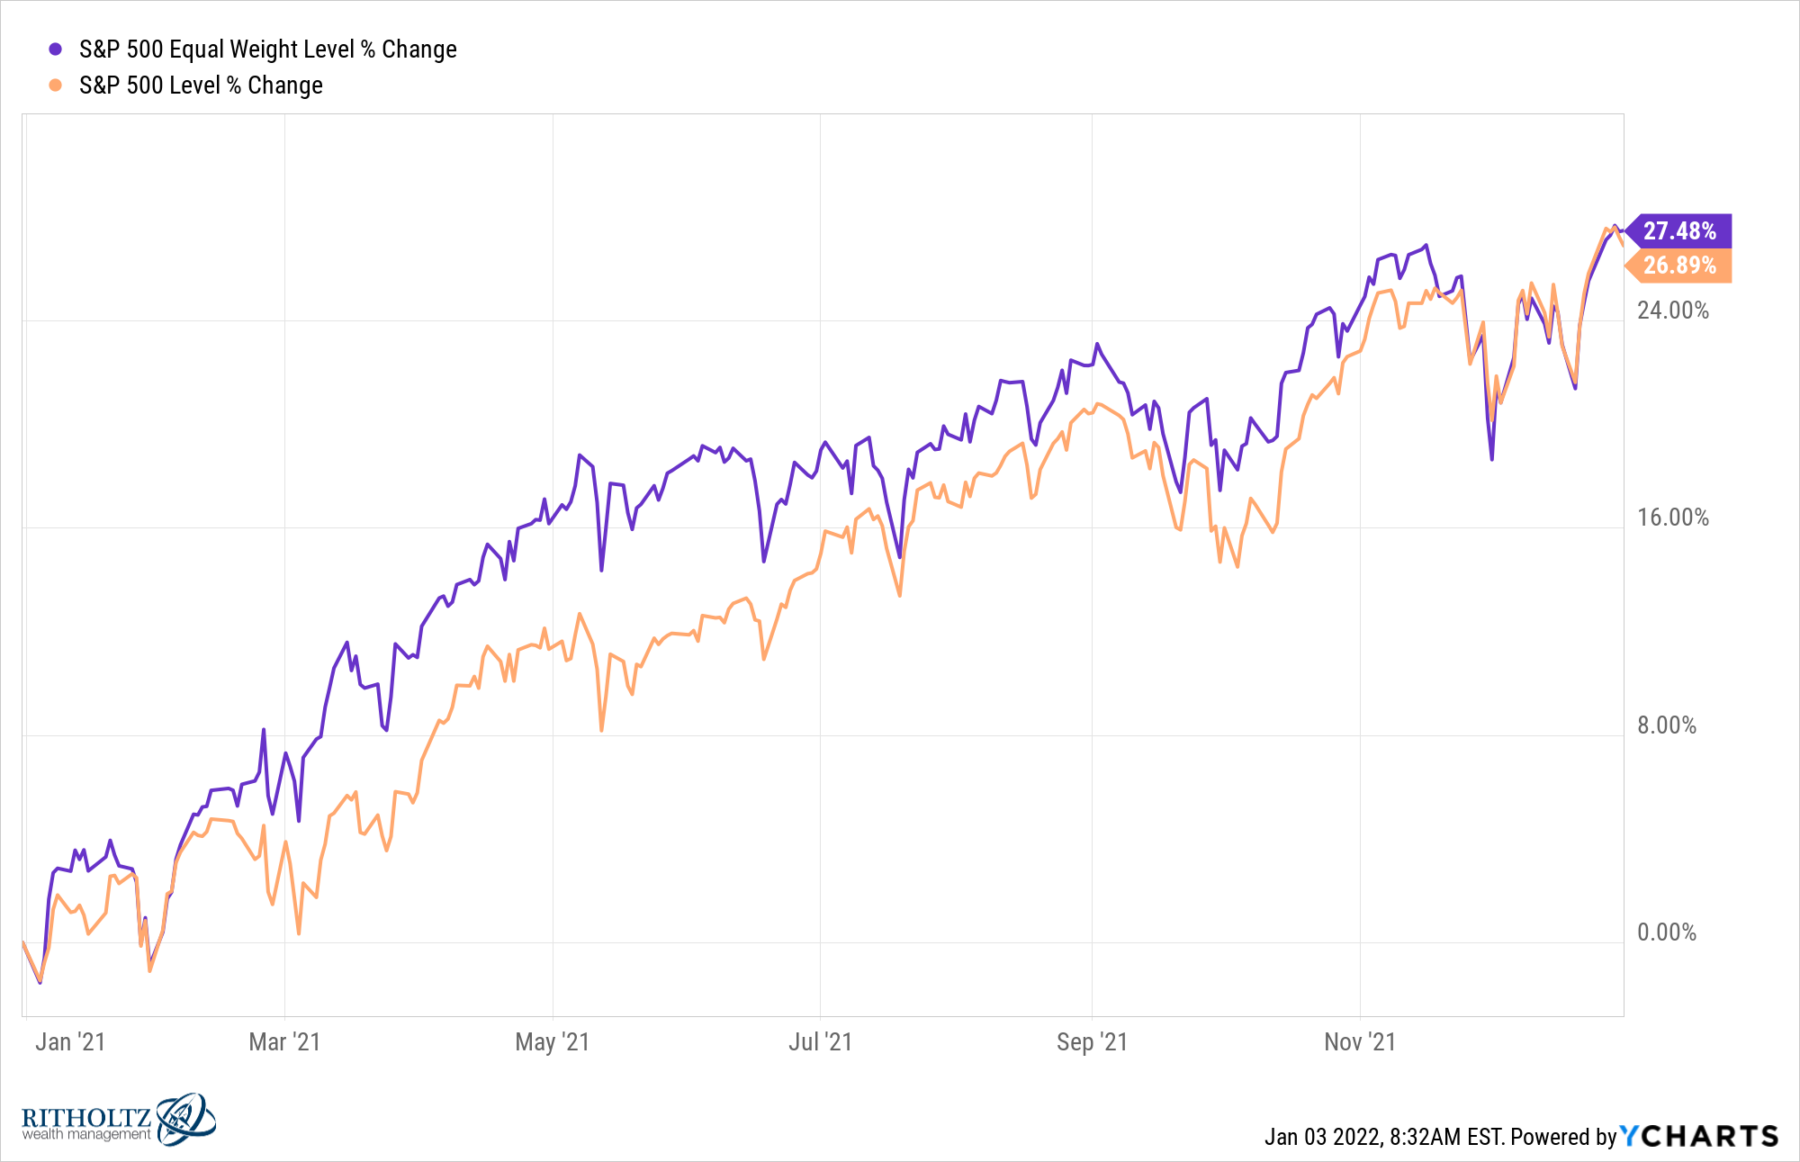
The answer is a thorough repudiation of the claim that markets are being driven by just 5 stocks:
S&P500 (SPX) = 26.89%.
S&P500 (IQX) = 27.48%.
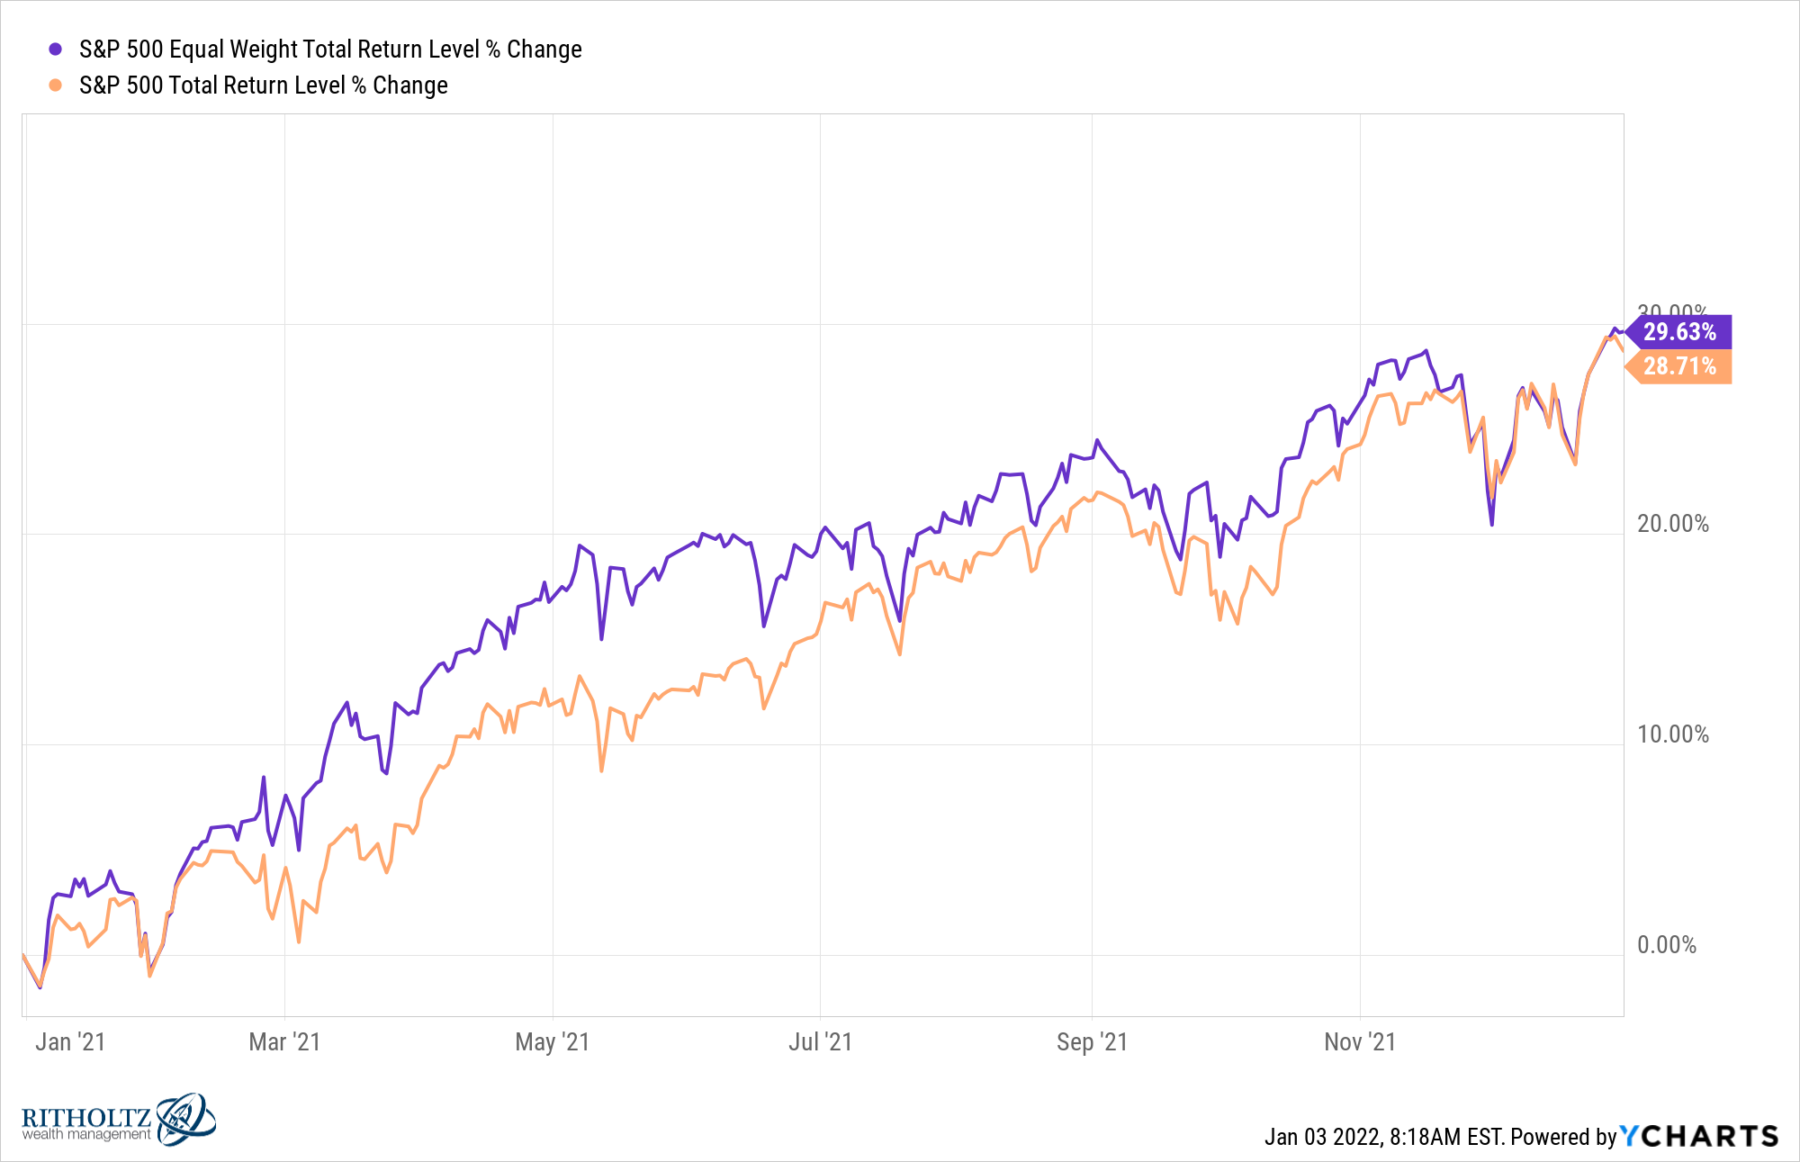
 While the S&P500 cap-weighted index had an excellent year, gaining just under 27%, the equal-weighted index edged it out by 59 basis points. And it’s not merely the price index, if we look at the total return of both, equal weight beats cap weighting by a greater amount: 29.63% versus 28.71%.
How could this be?
The general answer is that the current market is healthy, with broad participation by lots of companies. The combination of Fiscal and Monetary stimulus, near full employment, and robust retail sales has impacted lots of companies in terms of revenues and profits.
Getting more granular, consider the specific sectors of the S&P500 (I used the Select Sector SPDR ETFs as an easy way to do these comparisons): Consumer Staples (XLP) had a good year, up 14.3%; the Industrials (XLI) did even better, up 19.5%. Even Utilities (XLU) had a good year, gaining 14.2%. Note Consumer Discretionary (XLY) +27.2%, Health Care (XLV) +24.2%, and Materials (XLB) at +25.2% all finished within a point or so of where the index finished the year.
What were the big surprises, besides Technology (XLK), which soared 33.7%?
The first surprise was the Financials (XLF), which was right behind technology, adding 32.5%. But the biggest surprise had to be Energy (XLE), which added 46.4% for the year.
~~~
When you hear people say it’s only 5 stocks driving the market, it is because they have not looked at actual market data, specific S&P sectors, or even something as simple as the equal-weighted S&P index.
This is a broadly driven market, with lots of participation by all of the sectors and many stocks. Historically, that has been very healthy for future returns.
See also:
The Market’s Okay (Irrelevant Investor, December 16, 2021)
Are 5 Stocks Really Carrying the Entire Stock Market? (Wealth of Common Sense, December 19, 2021)
S&P 500 Dispersion (Irrelevant Investor, December 21, 2021)
Previously:
Top 5 Stocks: What Does This Mean? (December 16, 2021)
How to Mislead with Data, Large Company Edition (November 12, 2021)
Criticism of Concentrated Index Risk Are Off Base (August 21, 2020)
Are Too Few Stocks Driving S&P 500? (June 20, 2017)
click for audio


