Imagine the impact of markets losing a ~quarter of their value in one trading session.
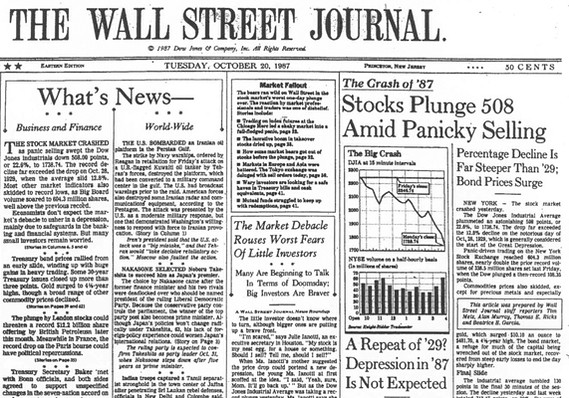
That was what happened 35 years ago next week: October 19th, Black Monday a/k/a the 1987 crash.
If you are a relatively young investor, you may be unfamiliar with what happened that day or why. The 87 crash impacted many market-related elements. We can trace lots of today’s market structure to that event, and the changes it wrought subsequently.
Consensus over the ensuing years has focused on several key drivers:
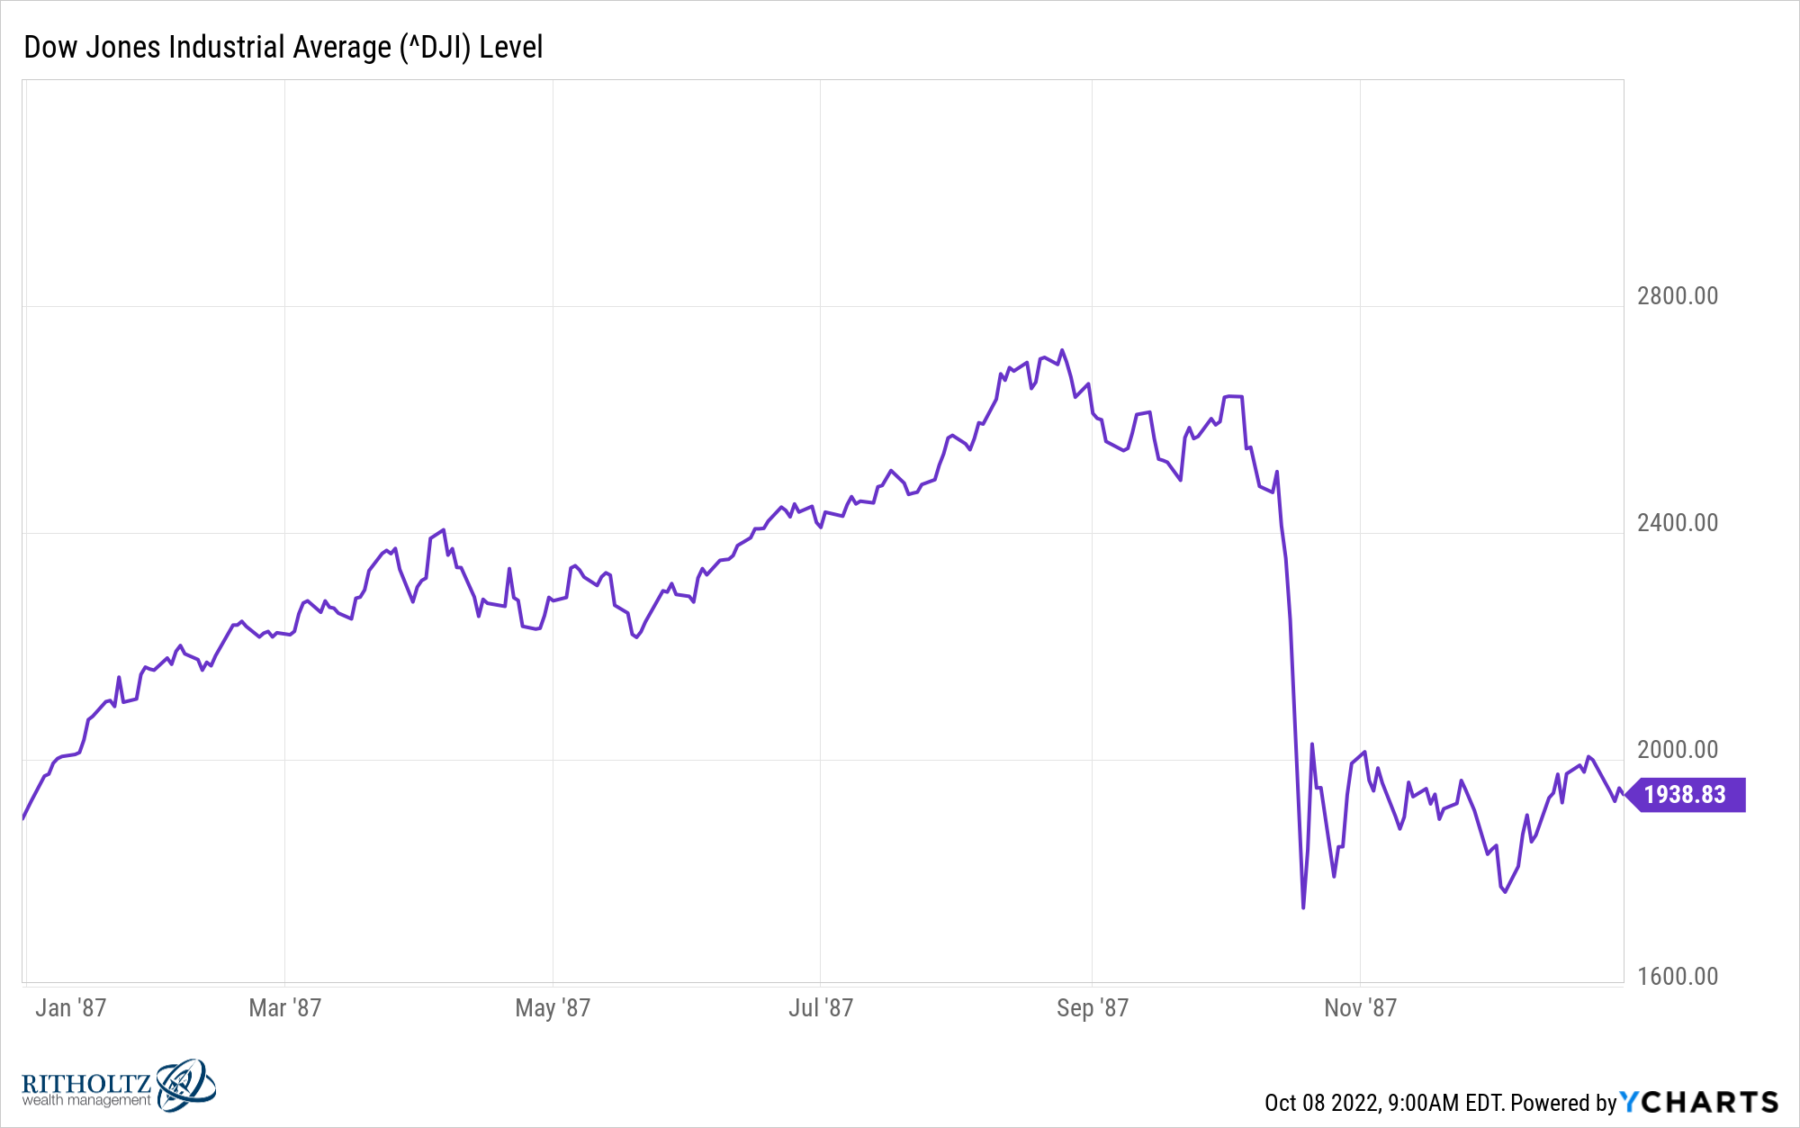
1. Overheated market: +42.5% for the first 3 quarters of the year;
2. Portfolio Insurance: Created a vicious feedback loop and added to downward pressure;
3. Index Futures Trading; Relatively new (1982) product allowed broad and leveraged exposure;
4. NYSE Infrastructure: Regarded as “broken,” overwhelmed by rising volumes, in desperate need of upgrades.
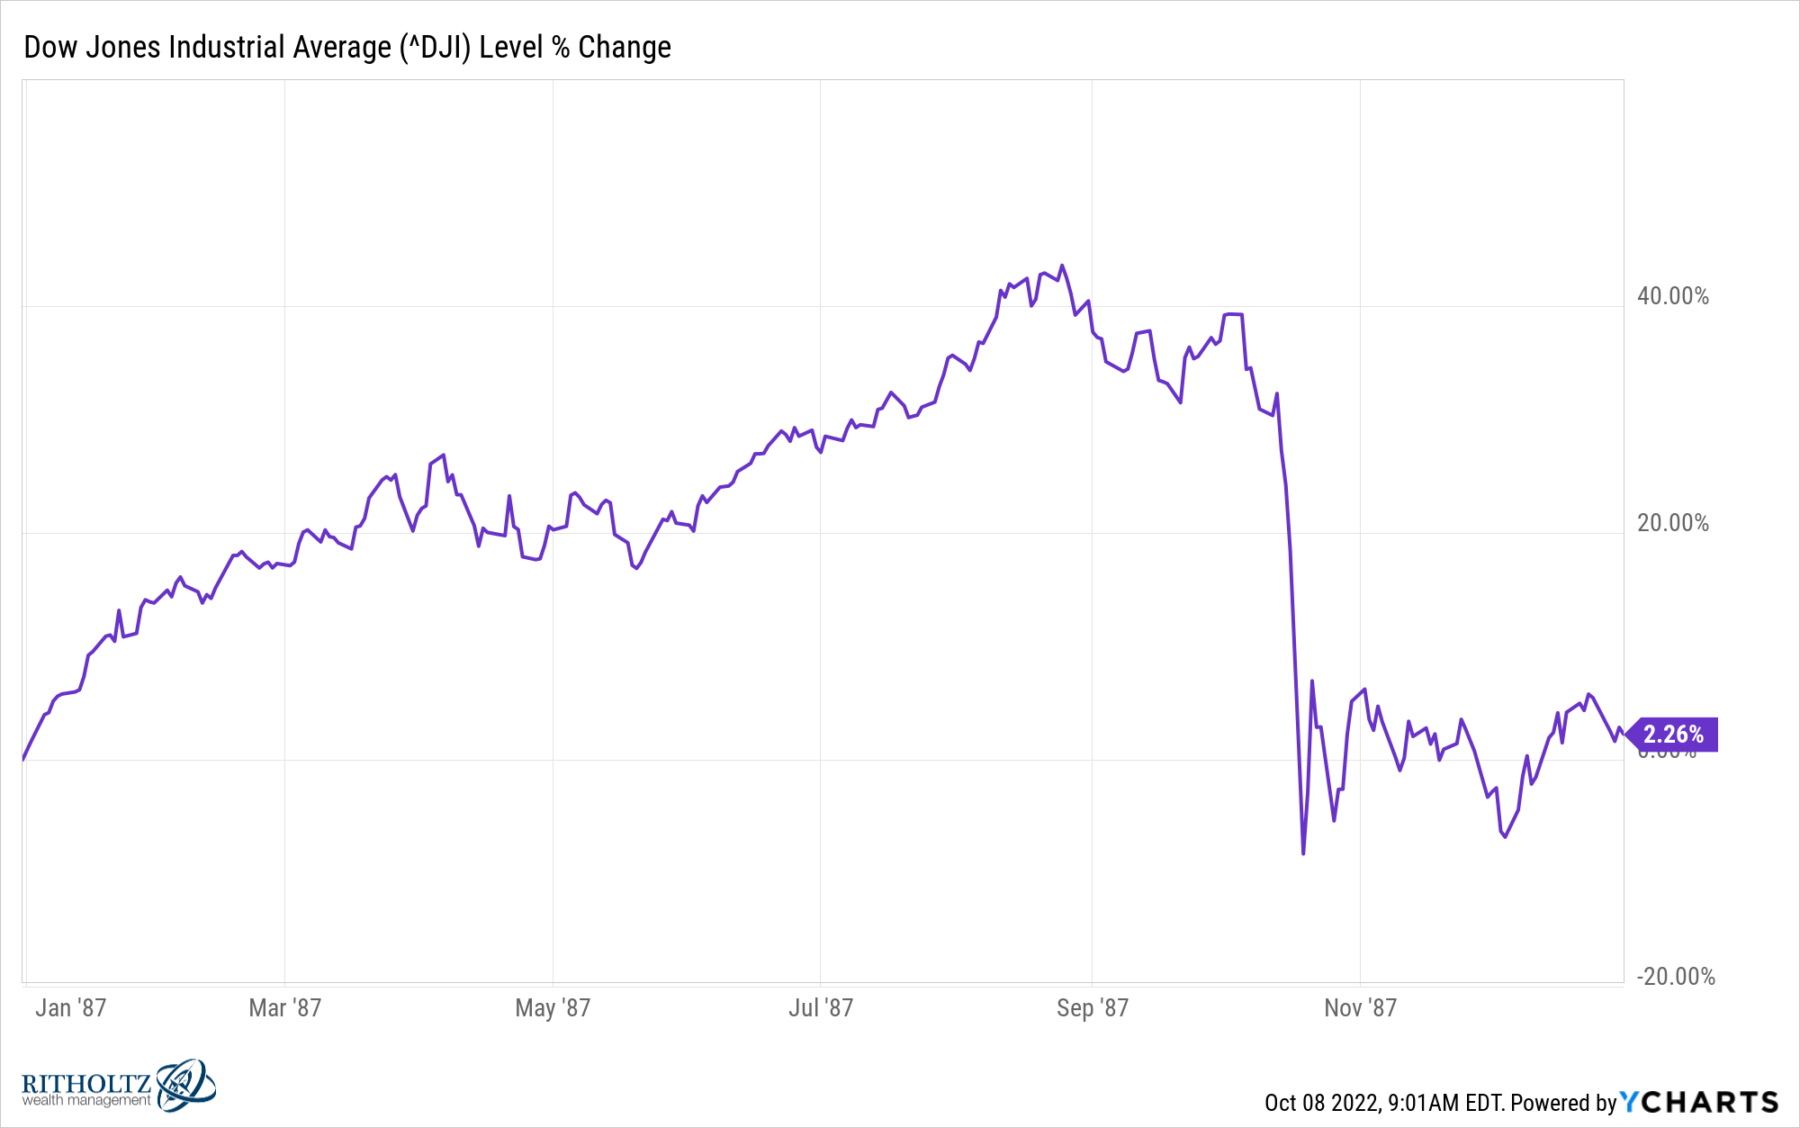
 Like most big events, it was likely caused by some combination of factors — the four above are the leading candidates. They created a unique set of circumstances that led to the biggest one-day percentage drop in market history – a 22% collapse for the Dow Jones Industrial Average.
A more difficult-to-quantify factor was psychology: The 1966-1982 secular bear market was still fresh in traders’ memories.1 Many doubted that the new bull market, dated to 1982, had staying power.
Even still, the Dow finished 1987 up 2.3%. For the full calendar year, the S&P 500 total return was +5.8%; the Nasdaq 100 lost -5.3%.
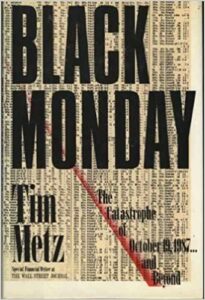
It was a unique but highly instructive era; for anyone who wants to dive deeper into history, Tim Metz’s Black Monday: The Catastrophe of October 19, 1987 … and Beyond — highly recommended!
Previously:
Where Were You On Black Monday? (October 19, 2015)
25th Anniversary Black Monday 1987 Crash (October 19, 2012)
Art Cashin: Black Monday, An Unforgettable Single Day (October 19, 2012)
________________
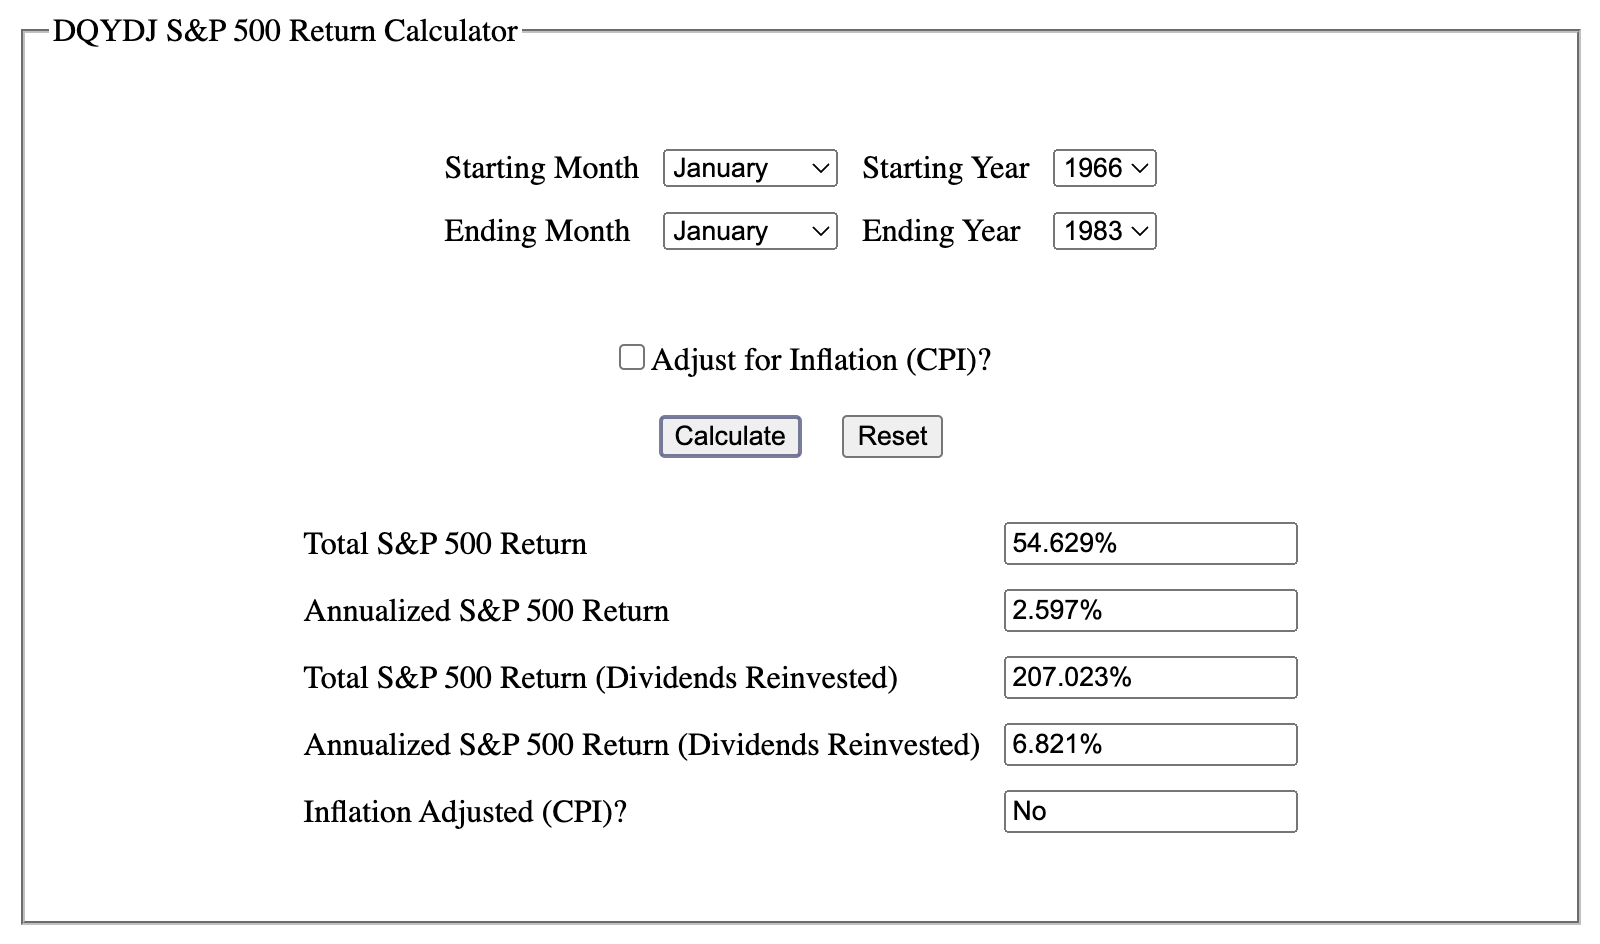
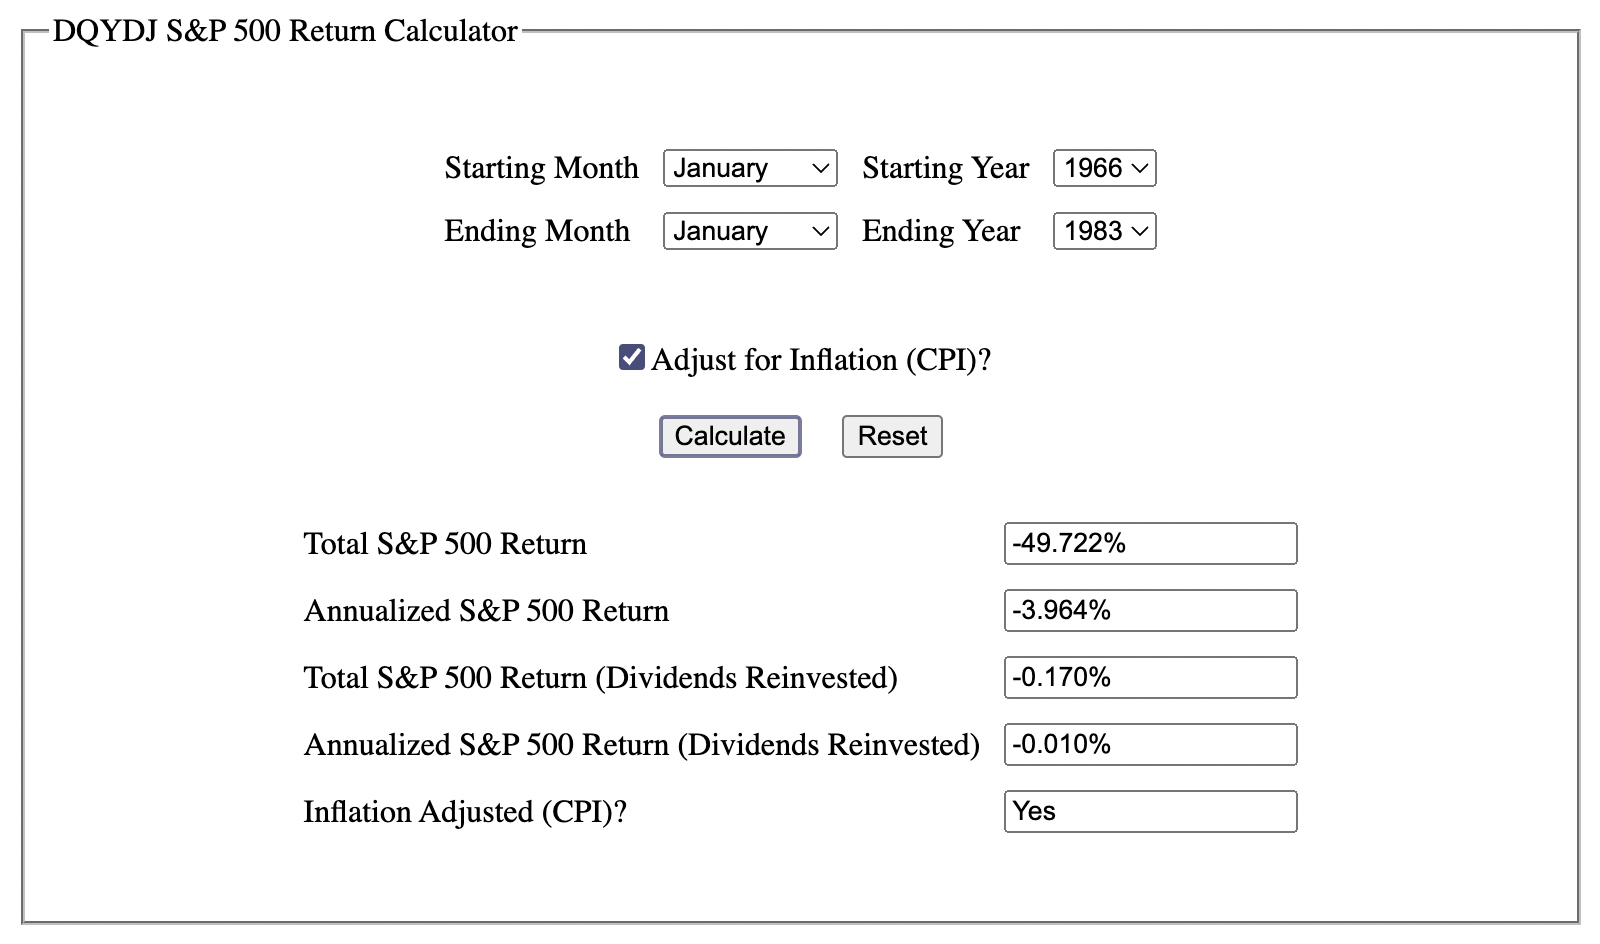
1. It was a volatile 17-year period with numerous rallies and selloffs. Markets were flat to modestly higher over that 16-year period. For the S&P500, the nominal return on investment was 54.6%. However, in real (inflation-adjusted) terms, they look quite different: Add in the effect of rising CPI and your returns plummet to -49.7%, or down -3.96% per year.
That is without dividends; including reinvested dividends and the returns over that period were 206% — but the inflation-adjusted returns were just 2.74%.
CPI and Dividend calculations via DQYDJ: