
A quick note on today’s BLS report on the Consumer Price Index (CPI), which rose 0.2% in July on a seasonally adjusted basis, Over the last 12 months, the CPI has increased 3.2%. Once again, the biggest part of the gains was for shelter. As I have noted before, the entity primarily responsible for rising home prices higher is the Fed.
There are numerous ways to measure price increases, and I wanted to highlight a specific approach the BLS occasionally references: “The 16% trimmed-mean CPI.” Unlike Core, which excludes the supposedly volatile food & energy categories, regardless of whether they are volatile that month or not. Instead, 16% trimmed literally does just that: It is a statistical method of calculating CPI that excludes price changes in the upper and lower tails of the distribution.
In other words, it removes the most volatile outliers — to the upside and the downside — from the monthly CPI calculation. What is left is a weighted average of inflation rates of those components that fall below the 92nd percentile and above the 8th percentile of price changes. Remove the outliers, and keep what is truly the core.
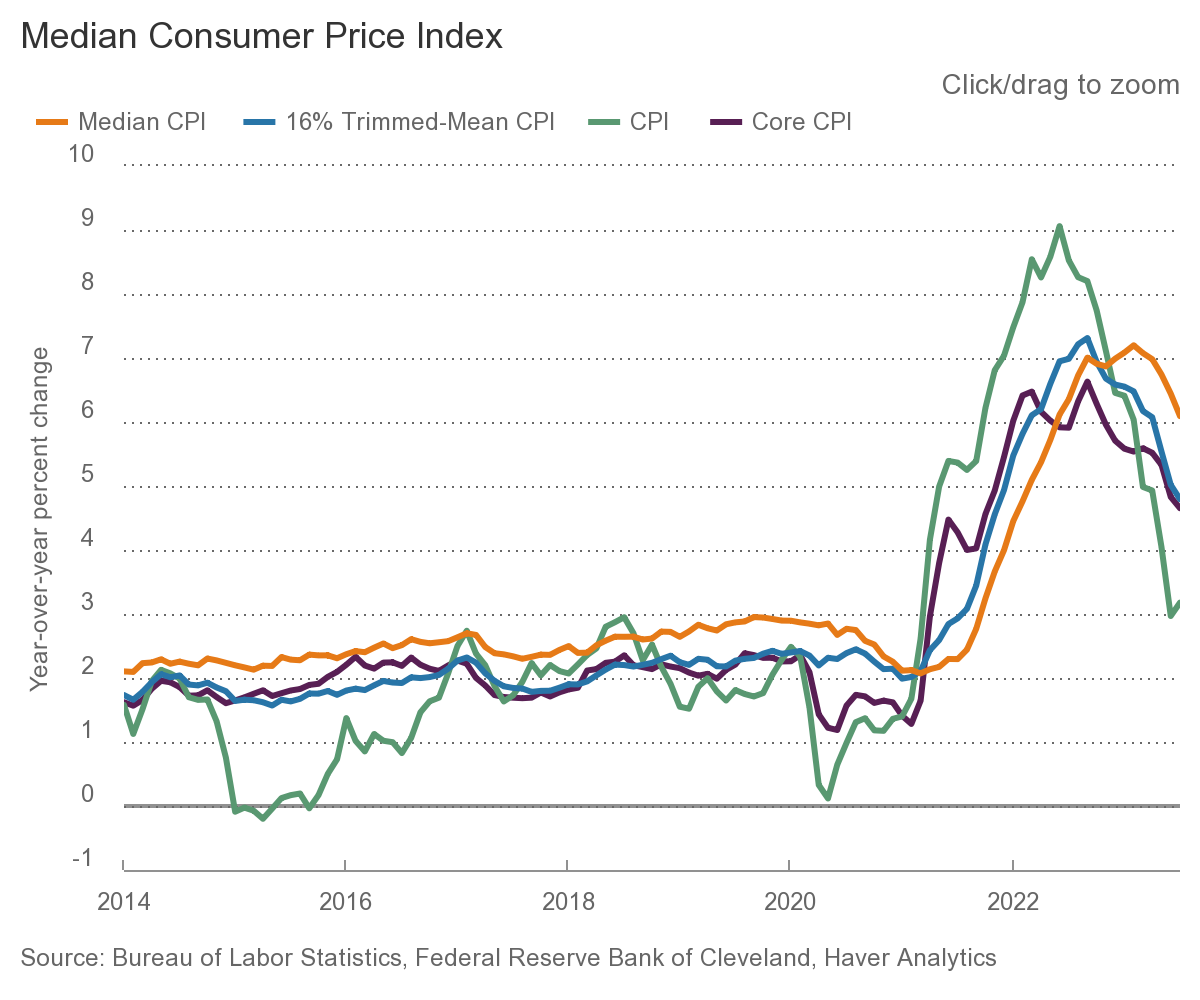
What is fascinating about this approach is revealed in the chart above. Core (purple) and 16% Trimmed (blue) CPI are at the exact same place today. But 16% Trimmed rose higher than did Core and is now falling faster than Core.
The Fed focuses on Core primarily to “reduce the volatility of the data series;” but as the chart above shows, 16% Trimmed is a smoother line and much less volatile than Core. It also gives you a broader and (I would argue) more accurate read of price changes.
Perhaps those interested in inflation policy should take note…
Source:
Median CPI
Change in median and in 16% trimmed-mean CPI
Cleveland Fed, August 10, 2023
