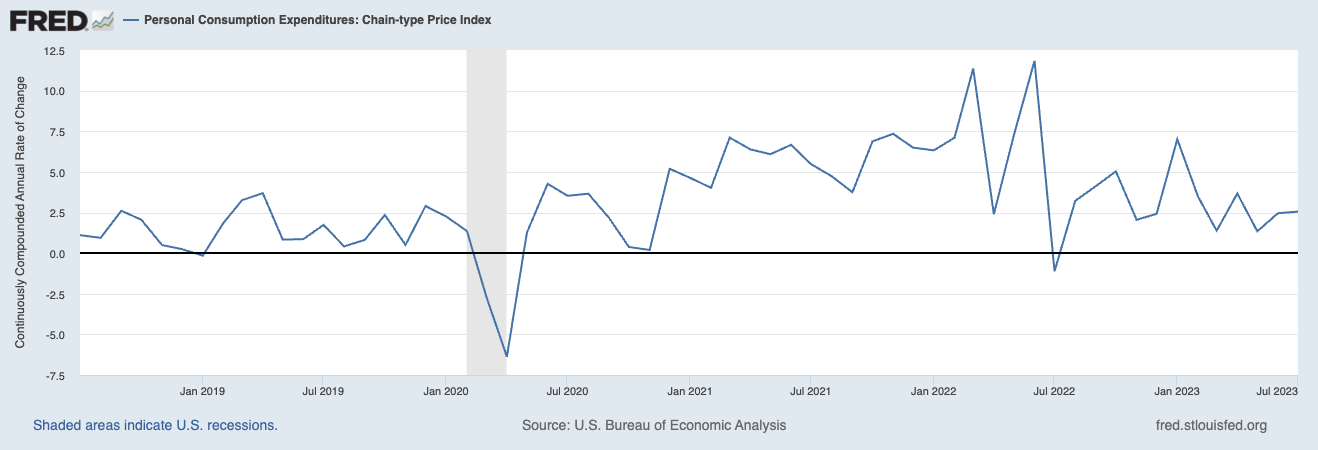
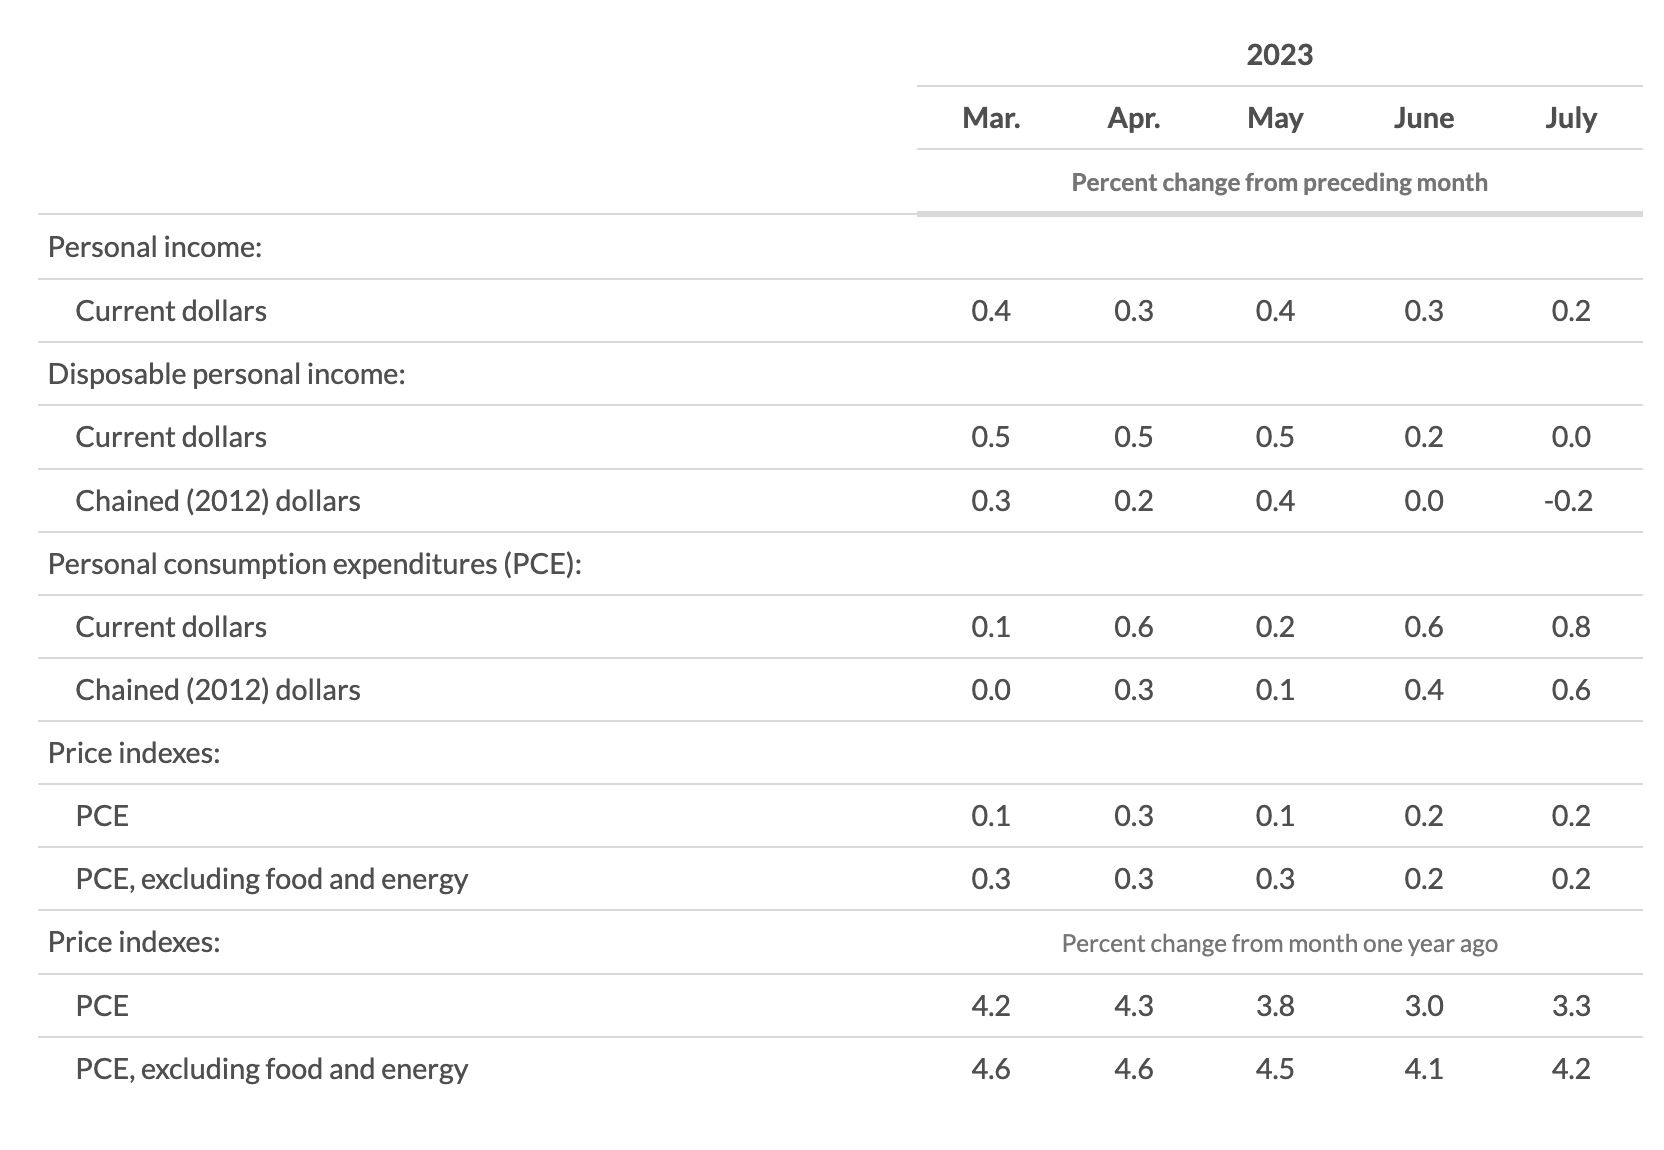
The Fed’s favored inflation report was a 2.1% annualized (3 months through July) and 3.3% year-over-year.
Here is BEA:
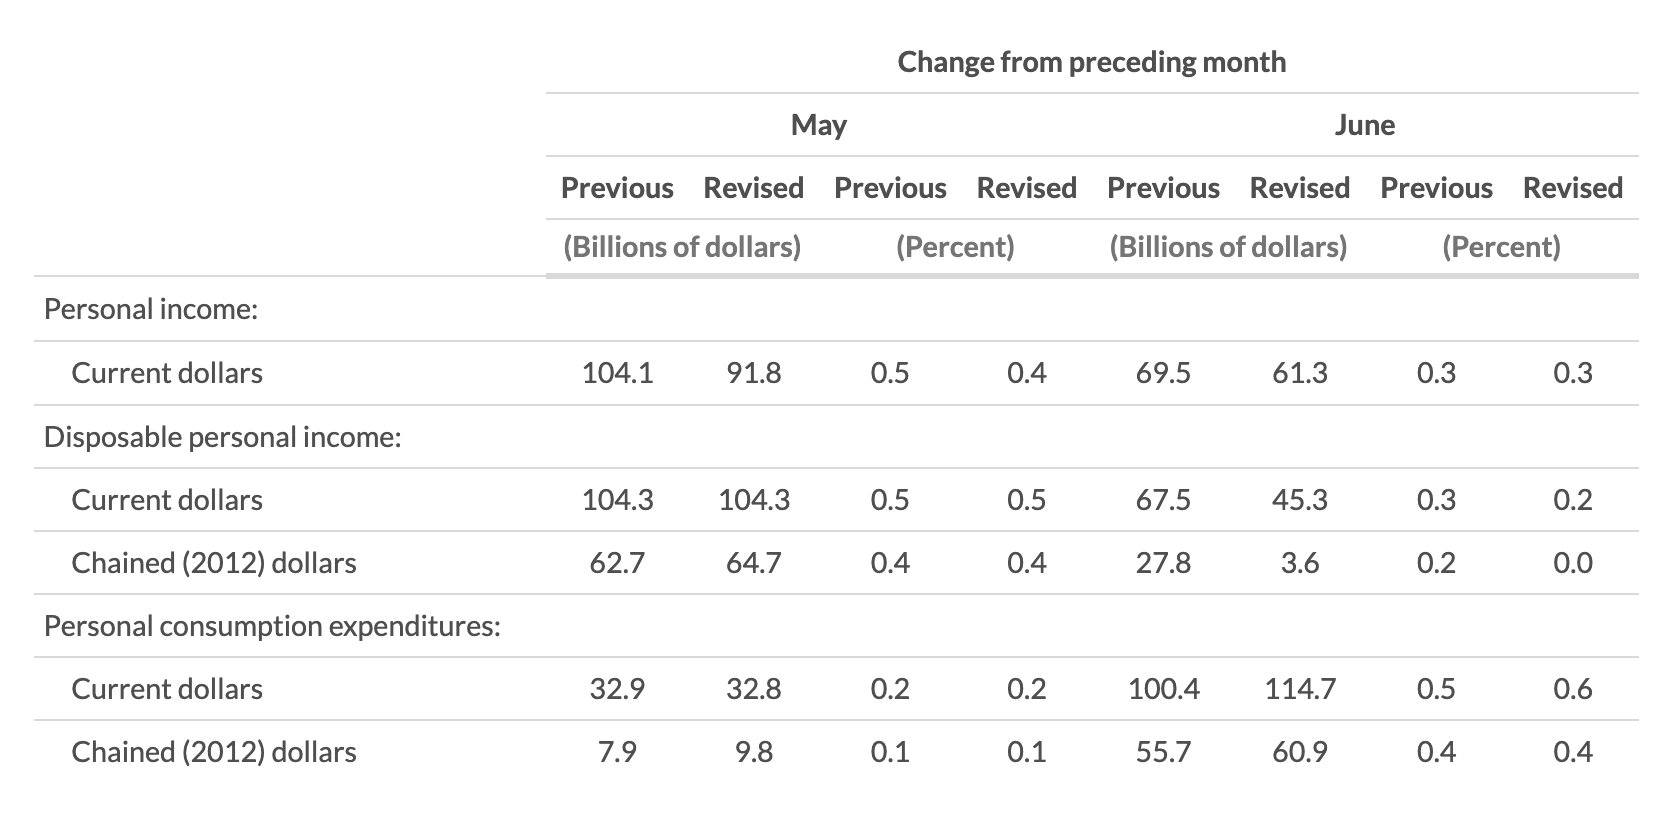
Personal income increased $45.0 billion (0.2 percent at a monthly rate) in July, according to estimates released today by the Bureau of Economic Analysis (table 3 and table 5). Disposable personal income (DPI), personal income less personal current taxes, increased $7.3 billion (less than 0.1 percent) and personal consumption expenditures (PCE) increased $144.6 billion (0.8 percent).
The PCE price index increased 0.2 percent. Excluding food and energy, the PCE price index increased 0.2 percent (table 9). Real DPI decreased 0.2 percent in July and real PCE increased 0.6 percent; goods increased 0.9 percent and services increased 0.4 percent (tables 5 and 7).
I feel like a broken record here, but 0.2%? PUH-leeze, the FOMC is done.
UPDATE: Aug 31, 2023 5:51pm
Right on cue, we get the latest rent data, showing Rent Deflation via Calculated Risk: Asking Rents Down 1.2% Year-over-year.
Here is Real Page breaking the data down by rental apartment class:
“As of July, annual asking rent growth was strongest in Class A units, accounting for a 1.4% price hike in the last 12 months, according to data from RealPage Market Analytics. Still, that marks quite a slowdown from the recent high of 18.6% in February 2022.
In Class B units, annual rent growth has slowed to just 0.5% in July after achieving a recent high of 16.4% in March 2022. In Class C product, which is more constrained by affordability and renter incomes, annual rent change has trickled to a 0.7% hike year-
Source:
Personal Income and Outlays (BEA, July 2023)
Previously:
Five Ways the Fed’s Deflation Playbook Could Be Improved (Businessweek, August 18, 2023)
2% Inflation Target is Silly (July 26, 2023)
A Dozen Contrarian Thoughts About Inflation (July 13, 2023)
Inflation Expectations Are Useless (May 17, 2023)
Some charts that make it look like I know what I am talking about…


