
We have no idea how good we had it.
Let’s consider the returns data from the period post-Great Financial Crisis (GFC), and then unpack what it might mean.
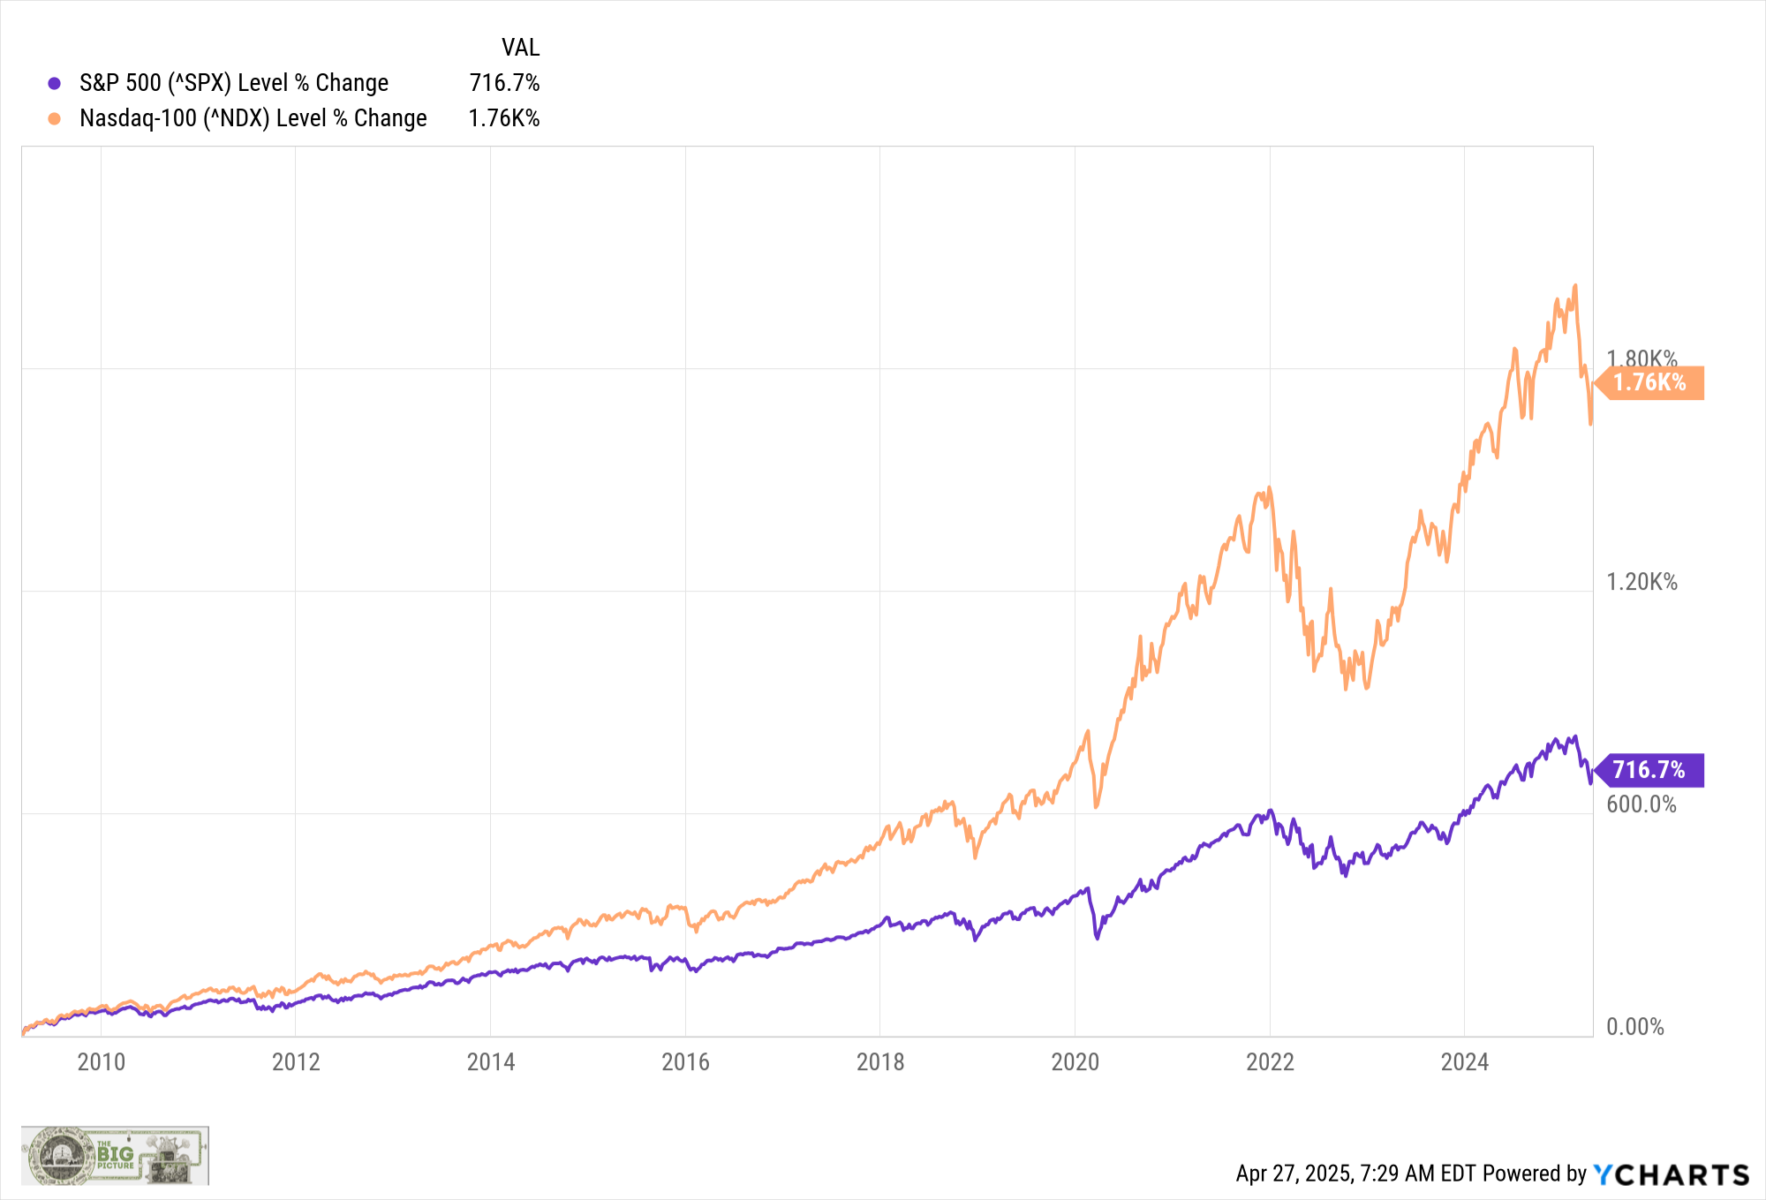
Starting January 1, 2010, the S&P 500 generated a total return (with dividends reinvested) of 566.8%, or 13.3% per year from the start of 2010 through the end of Q1 2025. The Nasdaq 100 has nearly doubled that. (Chart above is from March 2009, but that’s cheating)
Compare this to the average 15-year return periods over the past century, which generated ~8.7%. Average annual returns over the past century have been about 10.4%.
Using rolling 15-year period returns, we see how atypical this era has been. The only two better eras were the immediate aftermath of World War II through May 1957 (about 18% annualized) and the tech boom in the 1980s and 90s, 15 years peaking in April 1999 (around 17% annualized). This current 15-year peak was through February 2024 at ~16%.
Over the entirety of the post-GFC era, we have been averaging a third more than the typical annual returns since 1925, and nearly double the average 15-year stretch.
And that spectacular run of post-financial crisis returns have come with only a few minor setbacks:
-Flash Crash in 2010.
-2011 gain of “only” 2.1%
-2015 gain of “only” 1.4%
-2018 drop of 4.4%, including a Q4 drop of nearly 20%.
-Q1 2020 down 34% in the pandemic.
-2022 down 18% for the year.4
The full table of gains since the GFC looks like this:
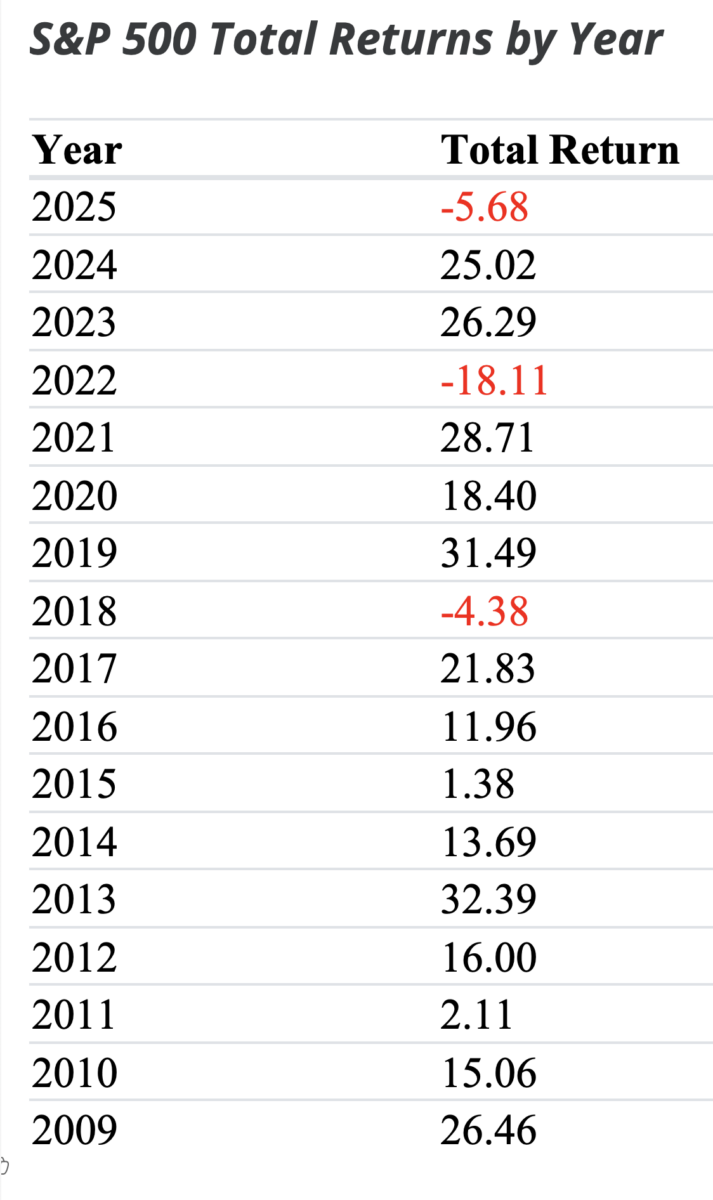
Table via Slickcharts
~~~
Main Street has now become a regular “BTFD” player. This is a direct result of muscle memory – a Recency Effect impact driven by 15 years of market gains. Over the entirety of the post-financial crisis era, we have enjoyed rising equity markets and until 2022, falling or zero interest rates. The good news is that this is how you build wealth over the long haul. Nick Maggiulli’s book “Just Keep Buying” makes this case very persuasively.
When we talk about muscle memory, what we are really discussing are habits for which we have been continuously rewarded. What breaks that prior habit depends upon how we change our behaviors in response to that punishment and reward.
Recall what happened during prior changes in market regimes.5 In the 1980s and 90s, dip buyers had been rewarded, despite the 1987 crash (the ultimate 22% dip!), the 1990 near-recession, a presidential impeachment, the Thai Baht crisis, the Russian Ruble default, Long-Term Capital Management collapse, and more.
For two decades, every dip purchase was soon rewarded.
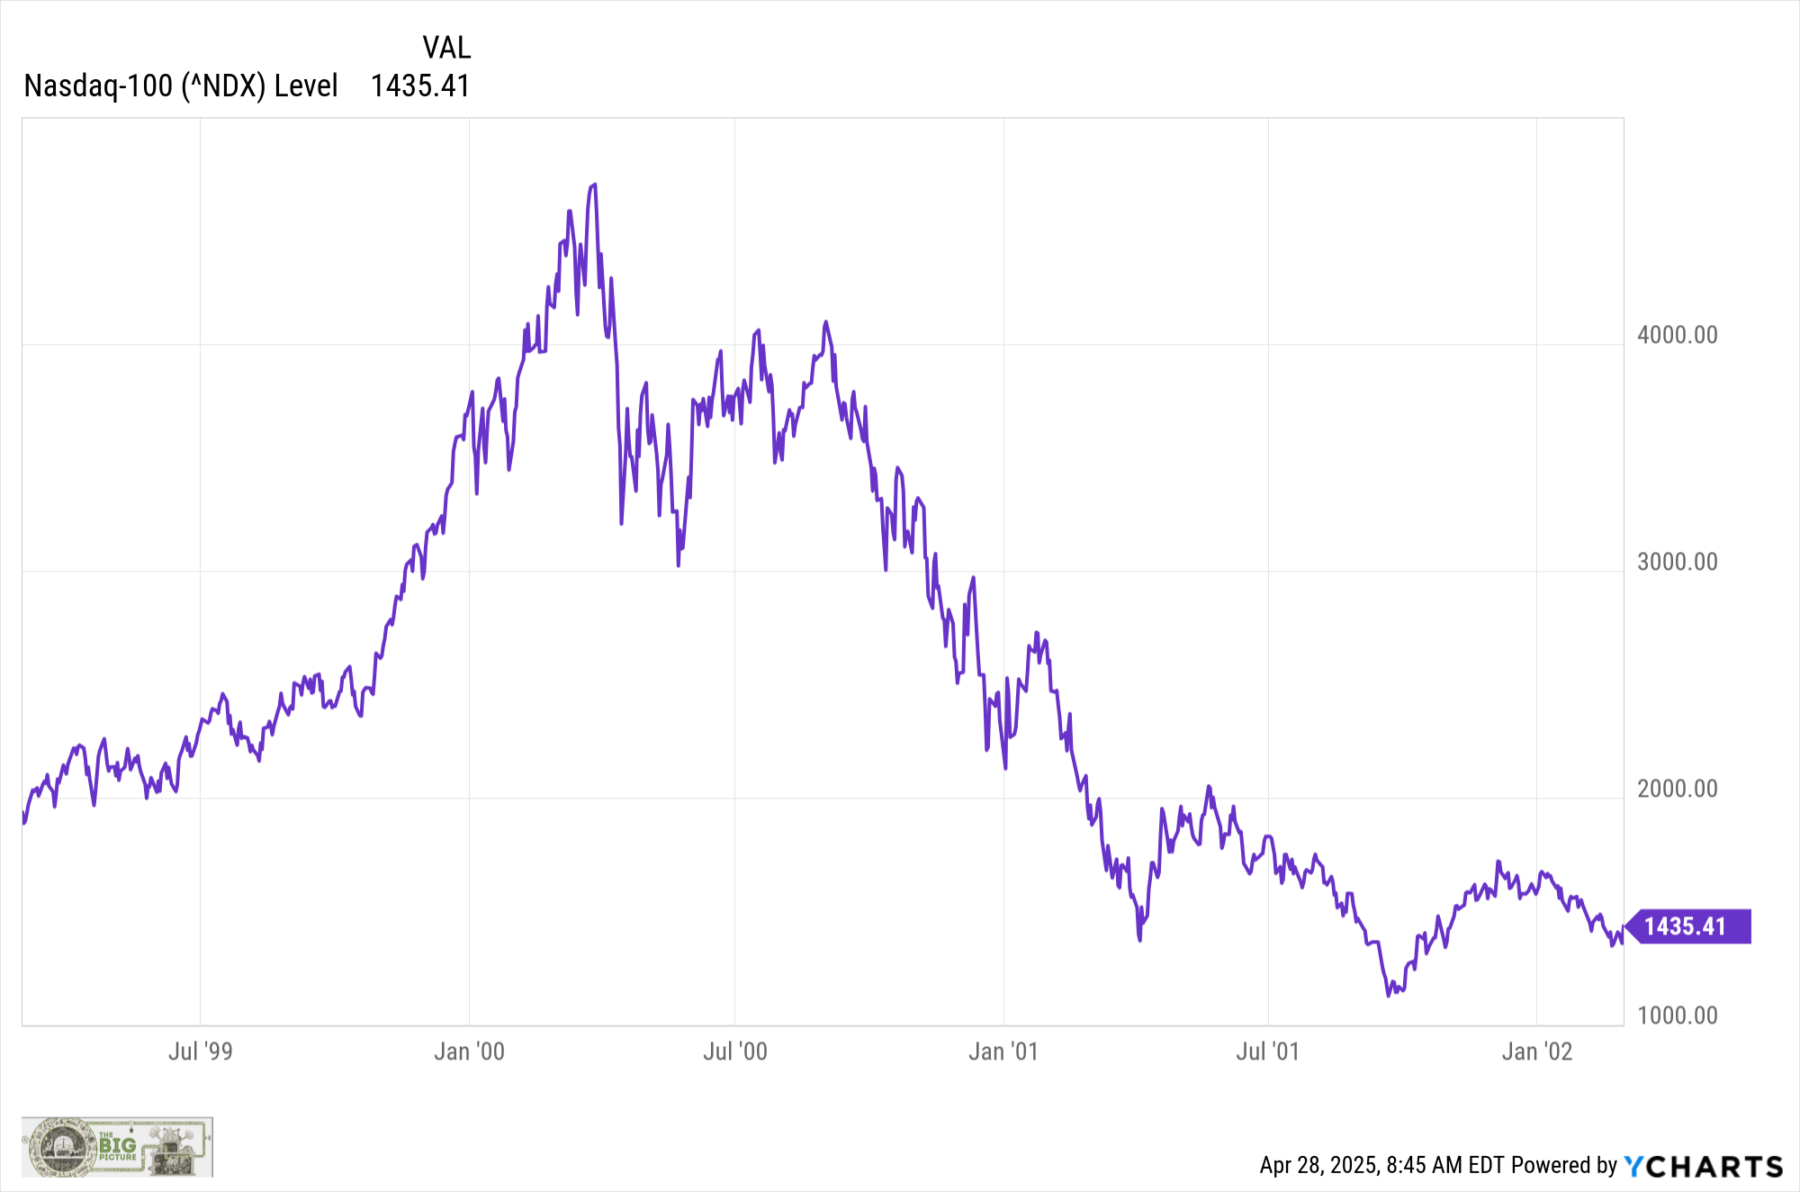
It takes a while to change behavior. Look at the dotcom implosion (and the September 11 terrorist attacks). From March 2000 to the double lows in October 2002 and March 2003, the Nasdaq 100 fell 82.9% (peak to trough). That was not a straight line down. Instead, we had a series of lower lows and lower highs — ask any technician what this means — until ultimately, a double bottom was formed in October 2002 and March 2003.
BTFD was a very painful, money-losing strategy to all but the most determined. All you had to do was ride out 36 months of constant pain, failed rallies, and losses. For most people, an ~83% crash in the Nasdaq 100 was way too painful to endure.
This is how BTFD died for that cycle…
~~~
We may have had it too good for too long – even though it didn’t feel that way. In October 2009, I called the move off the lows “The Most Hated Rally in Wall Street History.” In seven months, the S&P 500 had moved 57.5% from the bottom, and the Nasdaq 100 had gained 64.6%.
History informs us that when US markets get slashed by 56%, it creates a very advantageous entry point into equities for fresh capital. The recency effect challenges us to overcome the psychological stresses caused by a fresh, memorable crash. People fought the rally the entire way up, and continued so for years. “Financial Repression” was the rallying cry for underperforming managers.
Over the ensuing 16 years, the crowd may have forgotten that pain. Any single day where markets rally 12.5% is not what risk managers call a rational trading day.
Over the past decade and a half, BTFD has simply worked like a charm. Perhaps, it has worked too well. The risk is that if and when the trend changes, some traders will be slow to adapt; investors may become discouraged when they learn that investing for the “long term” is measured not in months or quarters, but in decades.
People hated the rising stock market in the early 2010s. The present concern is that, thanks to the Recency Effect, they no longer hate it enough…
UPDATE: 3:21pm April 28, 2025
Goldman Sachs makes the following observation:
Goldman Sachs flags incessant retail buying as one of the three major positives for US stock market
One increasingly prominent narrative to explain April’s V-shaped price action is that US stocks had a trust fall, and retail traders caught them. Scan the list of top-performing stocks from the Rose Garden reciprocal tariff announcement on April 2 through Friday’s close and you’ll see no shortage of popular names, headlined by Palantir’s 29% gain over the period along with double-digit gains for the likes of Netflix and CrowdStrike.
Goldman Sachs referred to this unrelenting retail bid as one of the “three constructive dynamics that are occurring in the market right now. Retail buyers haven’t blinked (and likely won’t unless you start to see unemployment rate tick higher),” Managing Director John Marshall wrote. This cohort has become a more active part of the market during the recent rebound in major indexes.
-via Sherwood
Previously:
The Most Hated Rally in Wall Street History (October 8, 2009)
___________
1. Data from Nick Magiulli’s return calculator.
2. If we wanted to cherry pick the data, we could start with the March 2009 end of the GFC, and the returns would be much higher, or date it from the pre-GFC peak in October 2007, and make the returns lower.
3. See also Lazy Portfolios rolling returns.
4. Plus bonds down 15% – the first double-digit drop for both asset classes at once in 4 decades.
5. I am not necessarily claiming a regime change is upon us; rather, it is a reminder of what happens when secular trends in markets reverse.
