A Cautionary Note on the Help Wanted Online Data
Tomaz Cajner and David Ratner
Federal Reserve, June 23, 2016
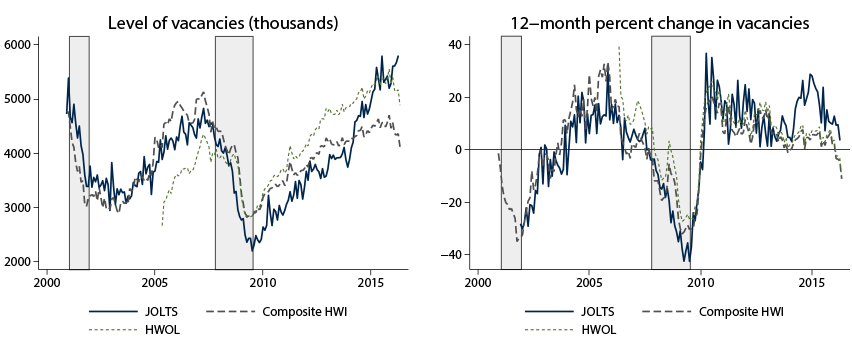
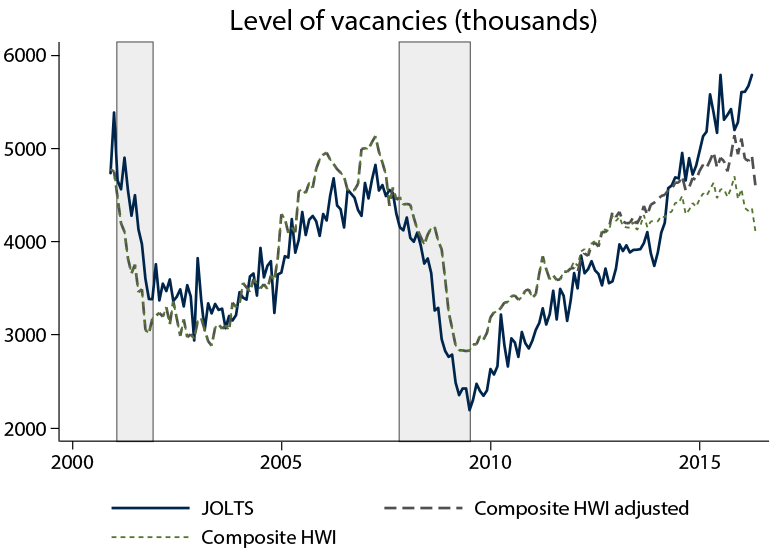
Measuring labor demand is one of the crucial tasks in analyzing the labor market. In the case of the United States, two main data sources geared towards this objective are the Job Openings and Labor Turnover Survey (JOLTS), administered by the Bureau of Labor Statistics, and the Conference Board Help Wanted Online series (HWOL). As shown in Figure 1, job openings as measured in JOLTS and the composite Help Wanted Index (composite HWI)–which adjusts the HWOL data for trends in online vacancy posting following the procedure proposed by Barnichon (2010) and rescales them to be comparable to JOLTS data–have tended to send similar signals about firms’ hiring intentions over much of the recent history. However, since the end of 2012, a substantial discrepancy between the two series emerged: according to JOLTS data the level of job openings rose by 48 percent between the end of 2012 and the end of 2015, while the composite HWI suggests a far more modest increase in vacancies of only 4 percent over the same period (unadjusted HWOL rose by 9 percent). This discrepancy has been noted by policymakers (Yellen, 2016) and raises important questions for researchers about which vacancy measure to trust. The present note argues that price changes for online job ads have importantly distorted the recent HWOL data and proposes adjustments to yield a series for online vacancies that abstracts from these prices changes.
The monthly HWOL data have been produced by the Conference Board since May 2005, replacing the Help Wanted Advertising Index of print ads, which was published from 1951 to 2008. HWOL data contain the universe count of all ads posted online during a month, with a mid-month survey reference period (e.g., data for October would be the sum of all posted ads from September 14th through October 13th). The HWOL program collects data from over 16,000 online job sources and removes duplicated ads. In contrast, JOLTS data are intended to measure a stock of job openings that businesses are actively recruiting to fill. Active recruitment may span multiple methods, including Internet job posting boards, advertising in newspapers, posting “help wanted” signs, tapping networks, or using word of mouth. Nonetheless, despite these methodological differences, JOLTS and the composite HWI data tracked each other remarkably well through about 2012.1
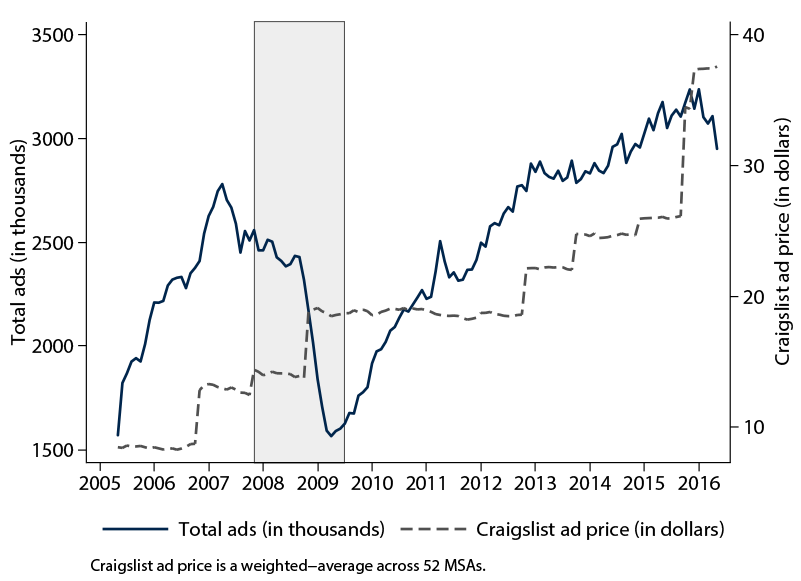
About 60 percent of online advertised vacancies are posted on only five of the largest job boards (Şahin et al., 2014). One of these five boards is Craigslist, which has used a particular business strategy in order to dominate the market for online vacancies. In particular, while its competitors like CareerBuilder or Monster typically charge $250-$500 for a 1-2 month job ad, Craigslist initially entered all geographical markets by allowing employers to advertise job postings for free. As a result, Craigslist “rose from near obscurity in 2005 to become a major contender, if not the leader, in online job posts by 2007” (Kroft and Pope, 2014). However, over time Craigslist gradually moved away from the model of free online vacancies and began charging $25 for a job ad in many metropolitan areas (Table 1). Moreover, at the end of 2015 Craigslist raised fees from $25 to $35 or $45 in selected metropolitan areas. All told, the average price for Craigslist job ads rose substantially, and roughly doubled since the end of 2012 (Figure 2), coinciding with the period when online vacancy posting as measured by HWOL noticeably underperformed the JOLTS vacancy growth.
| 2004 | Los Angeles, New York |
| 2006 | Boston, San Diego, Seattle, Washington DC |
| 2007 | Chicago, Orange County, Portland, Sacramento |
| 2008 | Atlanta, Austin, Dallas, Denver, Houston, Philadelphia, Phoenix, South Florida |
| 2012 | Detroit, Inland Empire, Kansas City, Las Vegas, Minneapolis, Orlando, St. Louis, San Antonio, Tampa |
| 2013 | Baltimore, Central New Jersey, Charlotte, Cincinnati, Cleveland, Columbus, Jacksonville, Long Island, Nashville, North Jersey, Pittsburgh, Raleigh |
| 2014 | Fort Myers, Hawaii, Indianapolis, Milwaukee, Norfolk, New Hampshire, Oklahoma City, Richmond, South Jersey, Tulsa |
| 2015 | Birmingham, Tucson, Hartford, Louisville, New Orleans, Buffalo, Rochester, Providence, Memphis |
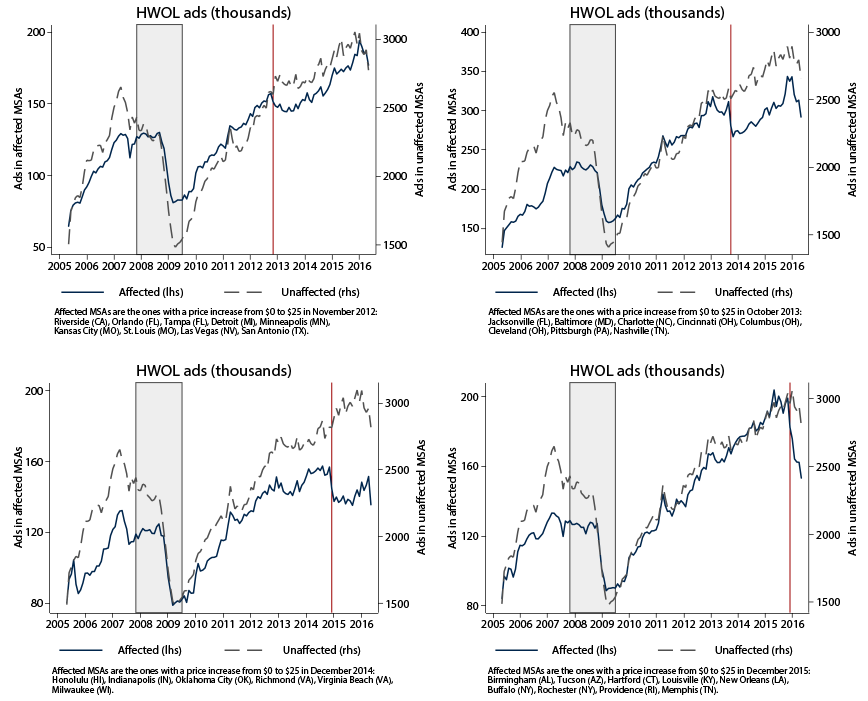
In this note we exploit the timing of Craigslist price increases by metropolitan area (MSA) to find their effect on online vacancy posting. Figure 3 illustrates our empirical strategy. We aggregate MSAs depending on the timing of their price increase (the affected groups experienced price changes from $0 to $25 in November 2012, October 2013, December 2014, December 2015) and compare them to a group without this price change (unaffected). From Figure 3 it is clearly visible that when Craigslist raised prices from $0 to $25, the number of total HWOL ads fell, and sometimes dramatically so.
 |
To gauge the impact of price changes on the level of the composite HWI, we proceed by estimating fixed effects regressions at the MSA level. Data on total HWOL ads are available for 52 MSAs with which we merge historical data for the prices of job ads on Craigslist. The econometric specification for the log of total (or new) HWOL ads, hit, in a city i and month t is given by


where we include L lags of the Craigslist posting price to capture the dynamics of adjustment that is clear from the figures above. 
 are MSA-level fixed effects and
 are month fixed effects. Our specification includes the current price and four months of lags of the price.
This empirical model allows us to estimate the price semi-elasticity of help wanted ads, controlling for the evolution of those ads in cities that did not experience a price change at the same time. Note that even if employers switched from posting on Craigslist to posting on another online board after the price increase, our empirical model would likely capture that substitution effect since the ads on the alternative board would most likely be counted in HWOL.
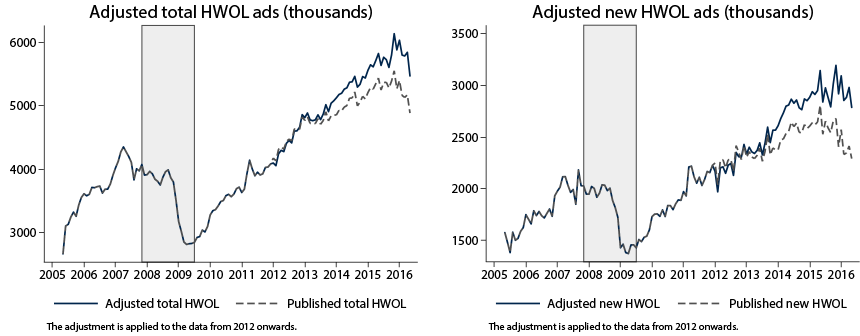
Holding the price level constant at its end-of-year 2011 levels, we predict the path of total (or new) HWOL ads for each MSA that would have emerged had Craigslist not raised their prices. We then apply the difference in ads implied by our estimated model to the HWOL measure of total and new U.S. ads.3 We plot the resulting counterfactual series for the HWOL and composite HWI series in Figures 4 and 5. Overall, Craigslist price increases can account for 12% lower level of total HWOL ads and 22% percent lower level of new HWOL ads at the end of 2015. In turn, Craigslist price changes by themselves can explain roughly one quarter of the discrepancy in the growth of JOLTS and the composite HWI measure of vacancies between the end of 2012 and the end of 2015.
In this note, we suggest that interpreting the measure of job vacancies from HWOL data requires careful consideration of changes in the quickly-evolving market for online job postings. We have analyzed one such change–rising prices for Craigslist job postings–which explains an important part of the recent divergence between JOLTS and HWOL vacancies. Our finding is reminiscent of similar concerns about the now obsolete Help Wanted Advertising Index of print ads, which was affected by changes in advertising practices and changes in competition within the newspaper industry (Abraham, 1987). Given the critical nature of HWOL data in tracking the health of the US labor market, we believe the adjustments proposed here are a step towards improving analysts’ ability to interpret these data and can lead to a fuller understanding of labor market developments in real time.
References:
Abraham, Katharine G. (1987). “Help Wanted Advertising, Job Vacancies, and Unemployment,” Brookings Papers on Economic Activity, 1:1987, p.207-243.
Barnichon, Regis (2010). “Building a Composite Help Wanted Index,” Economics Letters, 109(3), p.175-178.
Davis, Steven J., R. Jason Faberman, and John C. Haltiwanger (2013): “The Establishment-Level Behavior of Vacancies and Hiring”, The Quarterly Journal of Economics, 128(2), p.581-622.
Kroft, Kory and Devin G. Pope (2014). “Does Online Search Crowd Out Traditional Search and Improve Matching Efficiency? Evidence from Craigslist,” Journal of Labor Economics, 32(2), p.259-303.
Şahin, Ayşegül, Joseph Song, Giorgio Topa and Giovanni L. Violante (2014). “Mismatch Unemployment,” American Economic Review, 104(11), p.3529-64.
Yellen, Janet L. (2016). “Current Conditions and the Outlook for the U.S. Economy,” speech delivered at The World Affairs Council of Philadelphia, Philadelphia, Pennsylvania, June 6.
1. Note that each HWOL ad might represent one or more openings, potentially introducing a type of measurement error. Furthermore, HWOL includes ads for contract workers, while the latter are excluded from JOLTS. The job openings data represent a stock variable, collected for the last business day of the month. Interestingly, by analyzing micro data, Davis et al. (2013) find that 42 percent of hiring takes place at establishments with no reported vacancy going into the month. Return to text
2. Craigslist first began charging for job ads in San Francisco in 1998. The fee in San Francisco has been set at $75 since 1998, while in other cities Craigslist initially started to charge $25. Return to text
3. We are assuming that the percent difference in HWOL due to rising Craigslist prices is the same in the MSA-aggregated data and in the series for total U.S. ads. This is because Craigslist also raised prices in areas for which MSA-level data are not available, but the aggregate HWOL series includes these areas. Return to text
Please cite this note as:
Cajner, Tomaz and David D. Ratner (2016). “A Cautionary Note on the Help Wanted Online Data,” FEDS Notes. Washington: Board of Governors of the Federal Reserve System, June 23, 2016, http://dx.doi.org/10.17016/2380-7172.1795.
Disclaimer: FEDS Notes are articles in which Board economists offer their own views and present analysis on a range of topics in economics and finance. These articles are shorter and less technically oriented than FEDS Working Papers.

