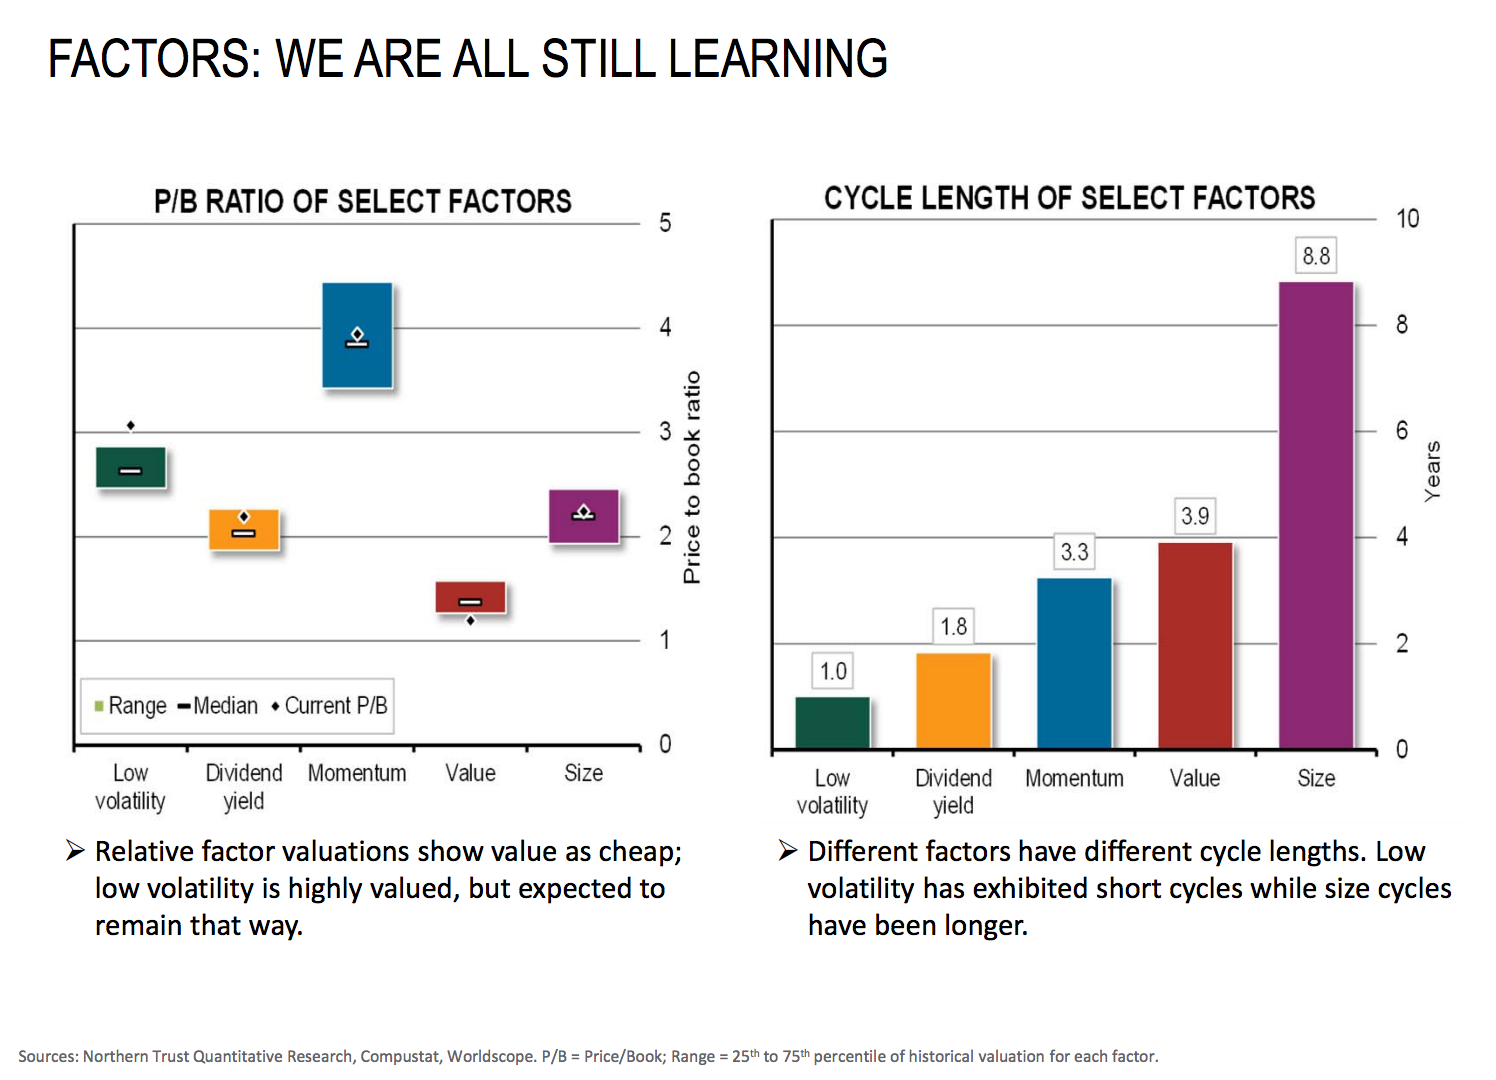
Another interesting set of graphics via Northern Trust; this one looks at factor performance by calendar year. The 2nd chart is quite intriguing:
This is very intriguing:

Source: Northern Trust
Another interesting set of graphics via Northern Trust; this one looks at factor performance by calendar year. The 2nd chart is quite intriguing:
This is very intriguing:

Source: Northern Trust