
On Monday, we discussed the counterfactual:
“Imagine a president, any president — party is of little importance here. He or she gets elected during a strengthening economic recovery. A year after the election, the economy is doing about as well as before — jobs are being created, growth is picking up, the unemployment rate continues to decline and the stock market keeps rising. This president passes a substantial tax cut. The economy continues to improve, and by the end of the second year in office, stock markets are at new highs, the unemployment rate has fallen to levels not seen in 60 years and consumer sentiment is at multidecade highs.
Now, ask yourself, what should that president’s approval ratings be? Maybe 75 percent? Even higher? If you said less than 70 percent, you’re kidding yourself.”
What might that look like in data form? For that, we go to Michael Cembalest – Chairman, Market and Investment Strategy, J.P. Morgan Asset Management.
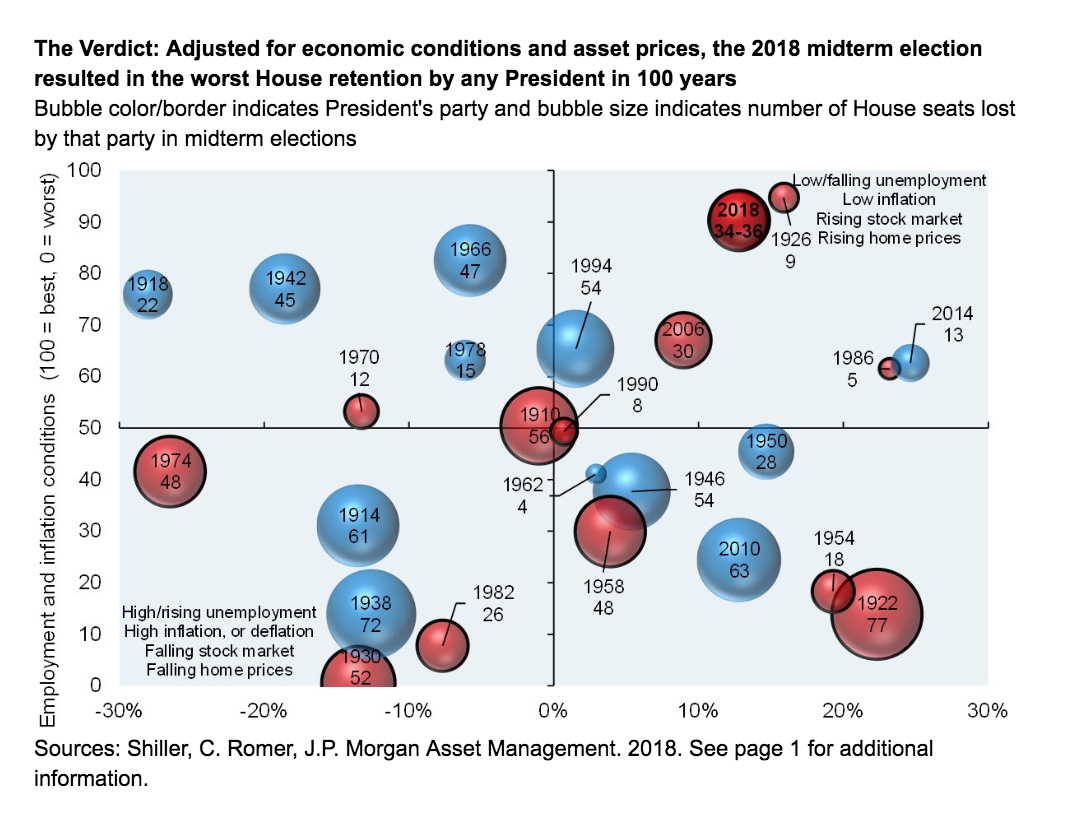
His fascinating version goes something like this: Adjusted for economic conditions and asset prices, 2018 midterms resulted in the worst House retention by any President in 100 years.
Here is what this looks like visually (see 2018 in the upper right):
Source: JPM
