
Rate of cases of COVID-19 per 100,000 people (as of May 11, 2020)
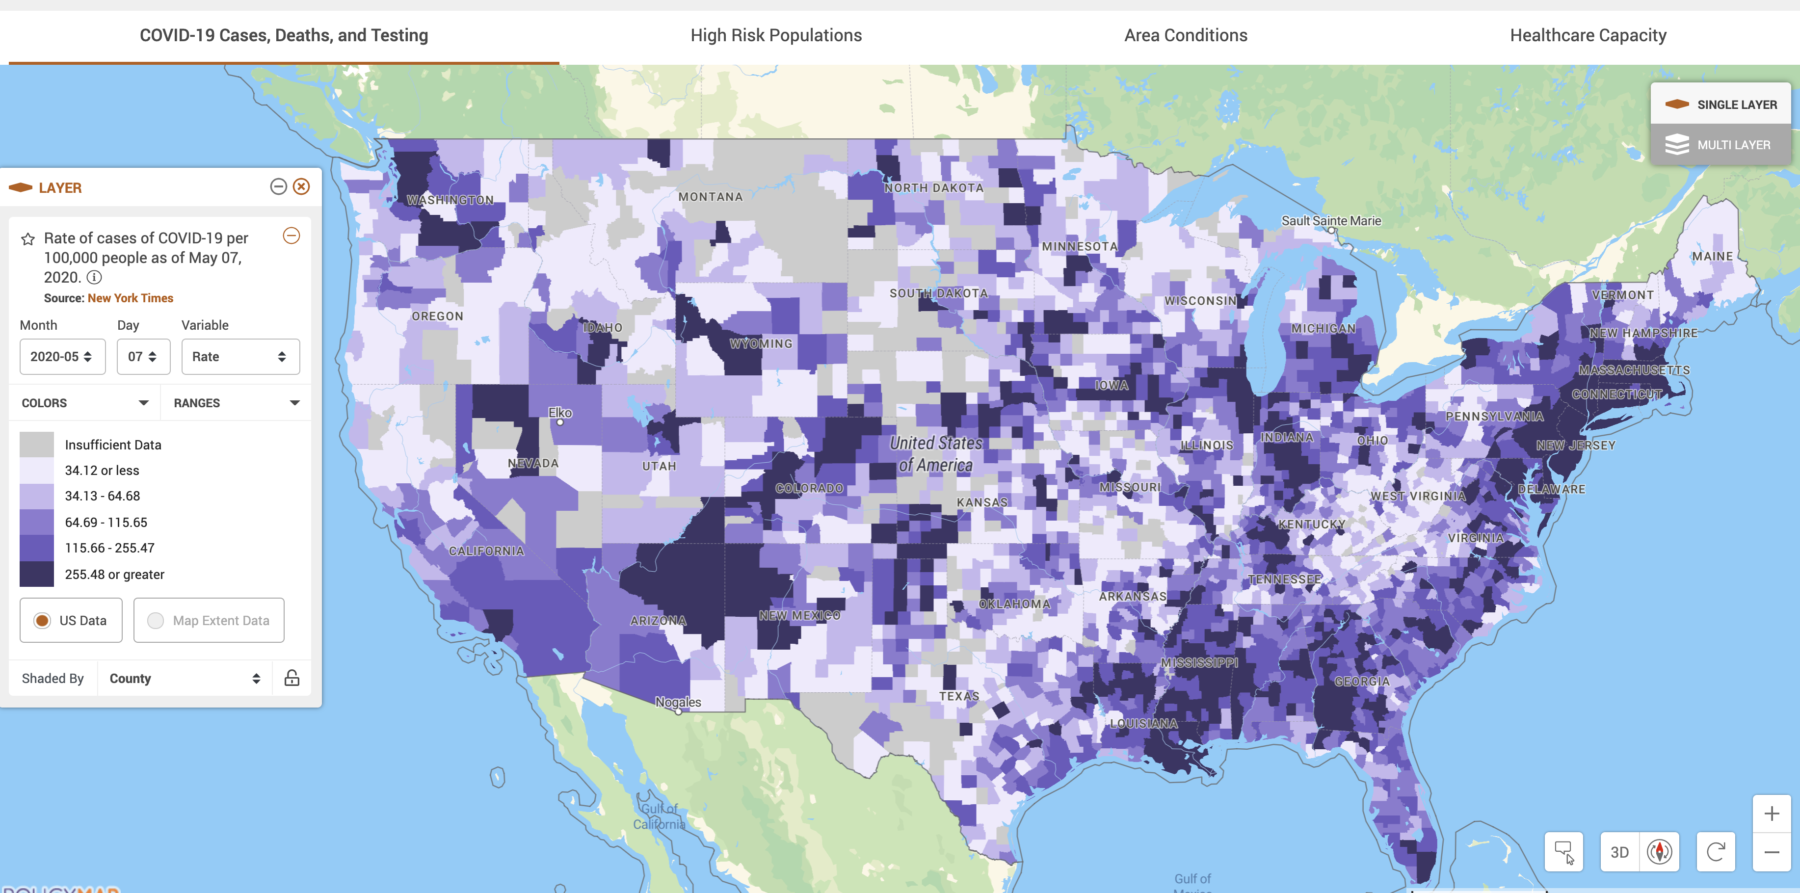
Source: Policy Map
This policy map is yet another good resource: It depicts a variety of data points on a very granular, county-level view. Data series include: COVID-19 Cases, Deaths, and Testing High Risk Populations, Area Conditions and Healthcare Capacity.
Looking at the nation on a county by county basis, as opposed to state level, shows how deep this pandemic has spread throughout the country.
Those who say this disease is a “Blue State” phenomena are not paying attention to the data.
See also:
Unreleased White House report has coronavirus rates spiking in heartland (NBC News)
Previously:
Which Countries Are Beating COVID-19? (May 11, 2020)
Are Re-Opening States Meeting Guidelines? see also When Each U.S. State Is Reopening Its Economy (May 7, 2020)
Sweden vs. Its Neighbors (May 5, 2020)
