
Top-Heavy Stock Indexes Are Nothing to Fear
It’s not rare for a small group of equities such as Apple, Microsoft and Amazon.com to account for a large percentage of the S&P 500.
Bloomberg, August 18, 2020
None of the criticisms levied over the years against indexing has undercut the primary advantages of passive investing: It’s cheap, simple and avoids the futility of stock picking.
Still, you have to give the opponents credit for persistence. They keep trying to convince investors that it is a poor approach to asset management.1
I calculated last year that more than $80 trillion in equities worldwide was actively managed, which shows why active managers want to protect their franchise from further erosion. Since the 2008-2009 financial crisis, about $1.8 trillion has moved out of active funds, while $2 trillion moved into passive. This makes for an incredible chart on capital flows.2
Even so, the criticisms are worth considering, if only to sharpen one’s thinking. In particular, the claim that indexing is dangerous because it represents a highly concentrated stock risk. In many major indexes that are weighted by market capitalization, such as the Standard & Poor’s 500 Index or the Nasdaq 100 Index, the six high-flying “FAANMG” stocks have gained disproportionate influence.3
A recent MarketWatch column asked, “How much of your retirement savings are you now gambling on the fortunes of just six companies? If you’re holding them in an S&P 500 stock market index fund, the answer is: About a quarter.”
I reached out to Howard Silverblatt, senior index analyst for S&P Dow Jones Indices, for more color. He noted that the 10 largest stocks in the S&P 500 accounted for 27.6% of the index’s capitalization. That makes the benchmark the “most top-heavy index” since the 1960s, according to Silverblatt. That may seem concerning, but history shows it isn’t. Year-end data Silverblatt shared going back 40 years showed the highest concentration of the top 10 stocks ranged from a low of 17.5% in 2014 to a high of 25.5% in 1980. That puts the current weighting a little above the range.
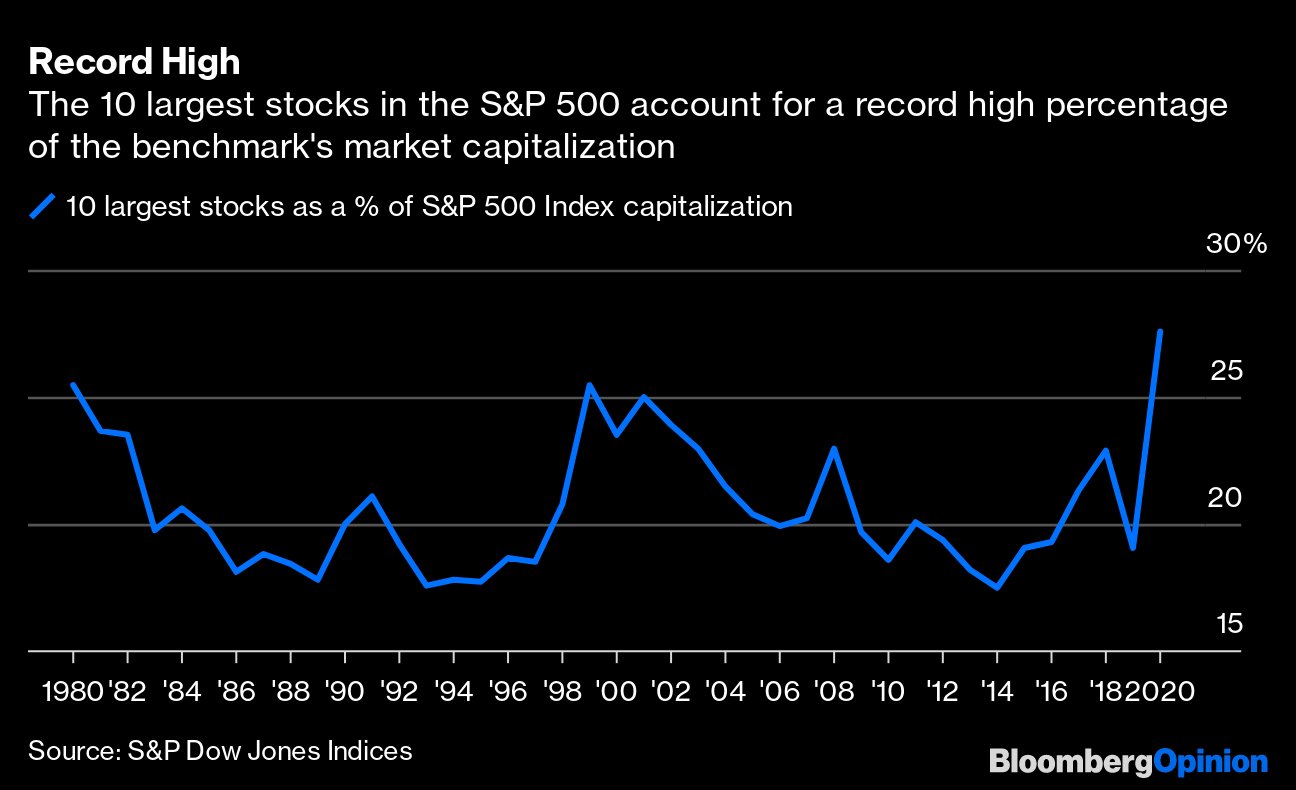
That high concentration to begin the 1980s did not prevent the market from seeing substantial gains that decade. The recovery from the 1970s bear markets and the double dip recession that began the 1980s eventually gave way to increased breadth, or greater market participation. In other words, as the economy helped small and mid-sized firms, the top-heavy index concentration decreased.
The bigger point is that it’s not rare for a small group of stocks to account for a large percentage of the S&P 500. What is important is the relative performance of those 10 stocks to the other 490 stocks. The ratio fluctuates based on which group is outperforming, resulting in a continuous battle between mega cap stocks and the merely large and mid-sized stocks.
Consider just some of the many variables affecting this relationship. For example, when overseas economies are soft, larger international companies may be less appealing to investors. Alternatively, a robust global economic expansion does the opposite, creating more opportunities for bigger companies than firms that lack an international reach.
The relationship between mega-cap stocks and all the others has been relatively tight – about 8% between the 1980 high concentration of 25.5% and the 2014 low of 17.5%.4 Credit the tendency for a rising economic tide to lift all boats. As employment increases, wages rise and consumer spending improves, all publicly traded companies tend to benefit.
What makes 2020 so unique is the externality of the pandemic and societal-wide lockdown. The economic impact hasn’t been evenly distributed. Large international tech companies essential to remote office work and people stuck in their houses have thrived. Add to that how much better the rest of the world has managed its response to the pandemic versus the U.S.’s bungled response. One would be hard pressed to find another era when circumstances led these two groups of companies to diverge as much as they have of late.
Consider another example of a non-economic externality parallel to the current Covid-19 circumstances: the Tōhoku earthquake and tsunami that damaged the Fukushima Daiichi nuclear reactors. Japan’s Nikkei 225 index fell 17.5% in the three trading days after the disaster hit, but the decline wasn’t evenly distributed. Sectors such as basic materials, apparel, machinery, retail and wholesalers were impacted very differently than those that suffered structural damage or disruption from the earthquake and meltdown.
But even that enormous event is nothing compared with this global pandemic. The economic impact of worldwide lockdown and re-opening has created a winner-take-all scenario, with a handful of companies capturing nearly all of the economic gains.
Eventually, an effective vaccine will be created than can treat Covid-19. When that happens, will the lockdown advantages of the giant tech companies and their shares reallocate back to other companies? Or, did the externality create a permanent advantage to the clever mammals which can use circumstances to supplant the bigger, less adaptable dinosaurs?
Regardless, neither mean reversion nor paradigm shift means that index funds represent a concentrated risk. They will go up and down with the market, just as they always have.
Previously:
Don’t Suffer From Denominator Blindness (October 14, 2015)
FAANMG Stock Prices Reflect Global, Not US Recovery (July 17, 2020)
Maybe Mr. Market Is Rational After All… (August 7, 2020)
How Externalities Affect Systems (August 14, 2020)
More Thoughts on Concentrated Index Risk (August 20, 2020)
_______
1. Some recent warnings about passive investing:
- Index funds are Marxist
- Or communist
- Or socialist
- Passive investing is “devouring capitalism”
- It has reached a “mania”
- Its creating “frightening” risk for markets
- It is “lobotomized investing”
- It represents a danger to the economy
- Your love of index funds is terrible for our economy
- They are a bubble waiting to burst
- Passive investing poses a systemic risk
2. Public to Private Equity in the United States: A Long-Term Look A Long-Term Look, by Michael Mauboussin and Dan Callahan, August 4, 2020.
3. Facebook, Apple, Amazon, Netflix, Microsoft, and Google
4. Top 10 market cap holdings in S&P500 as a percentage of total index value
| TOP 10 ISSUES | |||
| Market Cap | % of Index | RANK | |
| Avg: 1980-2019 | 20.74% | From ’80 | |
| 2019 | $6,490,672 | 23.08% | 8 |
| 2018 | $5,192,023 | 22.88% | 10 |
| 2017 | $5,087,944 | 21.25% | 12 |
| 2016 | $4,052,779 | 19.34% | 25 |
| 2015 | $3,699,235 | 19.10% | 27 |
| 2014 | $3,379,466 | 17.51% | 39 |
| 2013 | $3,202,276 | 18.24% | 33 |
| 2012 | $2,648,175 | 19.43% | 24 |
| 2011 | $2,405,093 | 20.14% | 18 |
| 2010 | $2,224,362 | 18.59% | 30 |
| 2009 | $2,040,929 | 19.72% | 23 |
| 2008 | $1,866,093 | 22.97% | 9 |
| 2007 | $2,682,513 | 20.22% | 17 |
| 2006 | $2,598,092 | 19.94% | 20 |
| 2005 | $2,349,514 | 20.37% | 16 |
| 2004 | $2,396,464 | 21.45% | 11 |
| 2003 | $2,335,859 | 22.98% | 8 |
| 2002 | $1,911,661 | 23.89% | 4 |
| 2001 | $2,598,656 | 24.96% | 3 |
| 2000 | $2,746,111 | 23.52% | 7 |
| 1999 | $3,126,121 | 25.47% | 2 |
| 1998 | $2,056,278 | 20.80% | 14 |
| 1997 | $1,388,663 | 18.50% | 31 |
| 1996 | $1,052,931 | 18.72% | 29 |
| 1995 | $813,291 | 17.74% | 37 |
| 1994 | $597,003 | 17.84% | 35 |
| 1993 | $580,807 | 17.57% | 38 |
| 1992 | $579,125 | 19.18% | 26 |
| 1991 | $595,495 | 21.08% | 13 |
| 1990 | $437,548 | 19.97% | 19 |
| 1989 | $420,413 | 17.78% | 36 |
| 1988 | $349,471 | 18.40% | 32 |
| 1987 | $325,943 | 18.81% | 28 |
| 1986 | $309,111 | 18.14% | 34 |
| 1985 | $296,757 | 19.76% | 21 |
| 1984 | $250,488 | 20.58% | 15 |
| 1983 | $241,243 | 19.75% | 22 |
| 1982 | $239,280 | 23.52% | 6 |
| 1981 | $204,356 | 23.71% | 5 |
| 1980 | $236,918 | 25.54% | 1 |
~~~
I originally published this at Bloomberg, August 18, 2020. All of my Bloomberg columns can be found here and here.
