
Source: Deutsche Bank
I have no real opinion on Bitcoin — I understand the basics of blockchain and mining, but I have nothing in the way of any unique insight or “edge” as to what its potential valuation might be. Hence, why your normally opinionated host usually has so little to say about it.
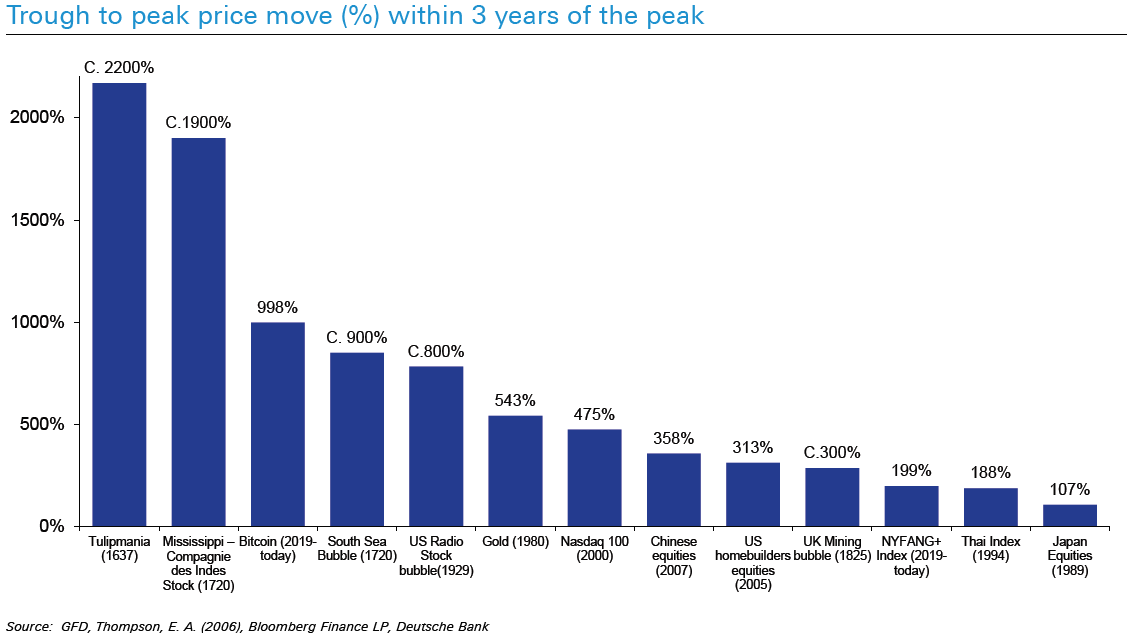
Regardless, I was intrigued by this analysis Jim Reid of Deutsche Bank. He looked back at historical bubbles, based on the trough to peak % move within three years of the eventual highs.
As Reid noted on January 22 2021: “Bitcoin price move to the recent peak was ‘only’ 1/2 of the tulip bubble back in 1637. It’s probably not a chart to take too seriously but it shows some of the big bubble type moves of the last 50 years.”
Hey, that’s as good a guess as anyone’s. I am not sure if the crypto bulls like DB’s analysis, but it does suggests that of Bitcoin were to become a full blown bubble 17th century bubble, it could kiss $100,000.
Here is Reid:
“In doing the research on bubbles for the pack, it was noticeable that there were more potential examples of bubbles over the last 50 years than any other period in history. This could be that more data is available now but my view has long been that it’s also a product of the fiat money system we’ve been in since 1971. I discussed this at length in my 2017 long-term study “The Next Financial Crisis” (link here) where I suggested that the fiat money era was much more prone to an endless cycle of boom and busts than systems where money was fixed to precious metals like gold. I still firmly believe this and continue to think we’re in a boom, bust, boom, bust (repeat to fade) global asset price era. For now we’re certainly in the liquidity fueled boom part!”
Previously:
When to Sell Bitcoin (December 20, 2017)
