
Don’t Fall for the ‘Cash on the Sidelines’ Trope
Money coursing through the economy can impact markets and investor sentiment for the better, just not in the way many think.
Bloomberg, April 12, 2021
I find myself bothered these days by the quality of both bullish and bearish market arguments. The most prominent is the meaning of “all that excess capital” that has been created by the Federal Reserve and U.S. government that is waiting to be deployed, with “massively bullish implications.”
This notion stems from actions by the Federal Reserve, which has no plans in the foreseeable future to raise its benchmark interest rate from near zero last year or stop pumping $120 billion into the financial markets each month through its quantitative easing measures, as well as the trillions of dollars in fiscal relief measures last April and December and again last month. Now comes the Biden administration’s proposed $2.25 trillion American Jobs Plan that focuses on infrastructure.
Sure, cash coursing through the economy can impact markets and investor sentiment for the better. Let’s see if we can better understand the facts behind some of the more popular claims to determine if they really affect asset prices.
Money Supply: The claim here is that the Fed has created an immense amount of cash as measured by M1, which is inflationary and “bubblicious” for financial markets. Morgan Housel, a partner at Collaborative Fund, has done the heavy lifting here, so we can dispatch with this one quickly:
“Money supply has increased from $4 trillion a year ago to $18 trillion today. A 350% increase! That’s something you might see in a third-world country with hyperinflation. But before you dump life savings into gold and build a bunker, here’s the punchline: The huge majority of the increase you’re seeing in this chart is not money printing or new money creation. It’s an accounting rule change.”
Cash on the Sidelines: The trillions of dollars sitting idly in brokerage accounts is just waiting to be put to work in the market. When it does, it will drive equity prices even higher. That is the breathless thesis of cash-on-the-sidelines proponents, and it fails to stand up under scrutiny.
Consider a hypothetical holder of that cash, such as an endowment, mutual fund or other capital allocator. This “buyer” goes into the market, purchases $1 billion of equities from a “seller.” Prior to the transaction our buyer had $1 billion in cash and our seller had $1 billion in stock. After the transaction, the buyer now has $1 billion in stock and the seller has $1 billion in cash. The cash merely transfers from one account to another. The total amount of dollars “on the sidelines” has not changed. As we discussed previously, “there is ALWAYS cash on the sidelines.” It is neither a leading nor lagging indicator.
Instead of cash on the sidelines, consider the velocity of money. When it’s high or accelerating, you can plausibly claim that cash finds its way into so-called risk assets such as equities, and that can drive prices higher. But velocity during the pandemic lockdown has been the lowest since the data series began in the late 1950s. If it begins to accelerate post-pandemic, you may assume it will find its ways into stock prices.
Cash allocated to individual portfolios: This very specific measure is really a gauge of sentiment, providing insights when it reaches extreme deviations from historical norms.
Consider the Asset Allocation Survey data collected by the American Association of Individual Investors. The historical average exposure to equities is just over 60%, while cash averages about 23%. Those numbers swing around the long-term baseline by about 15%. At market peaks, equities approach 75%, and near the lows they are in the 45% range. It seems that cash in those accounts are the key drivers.
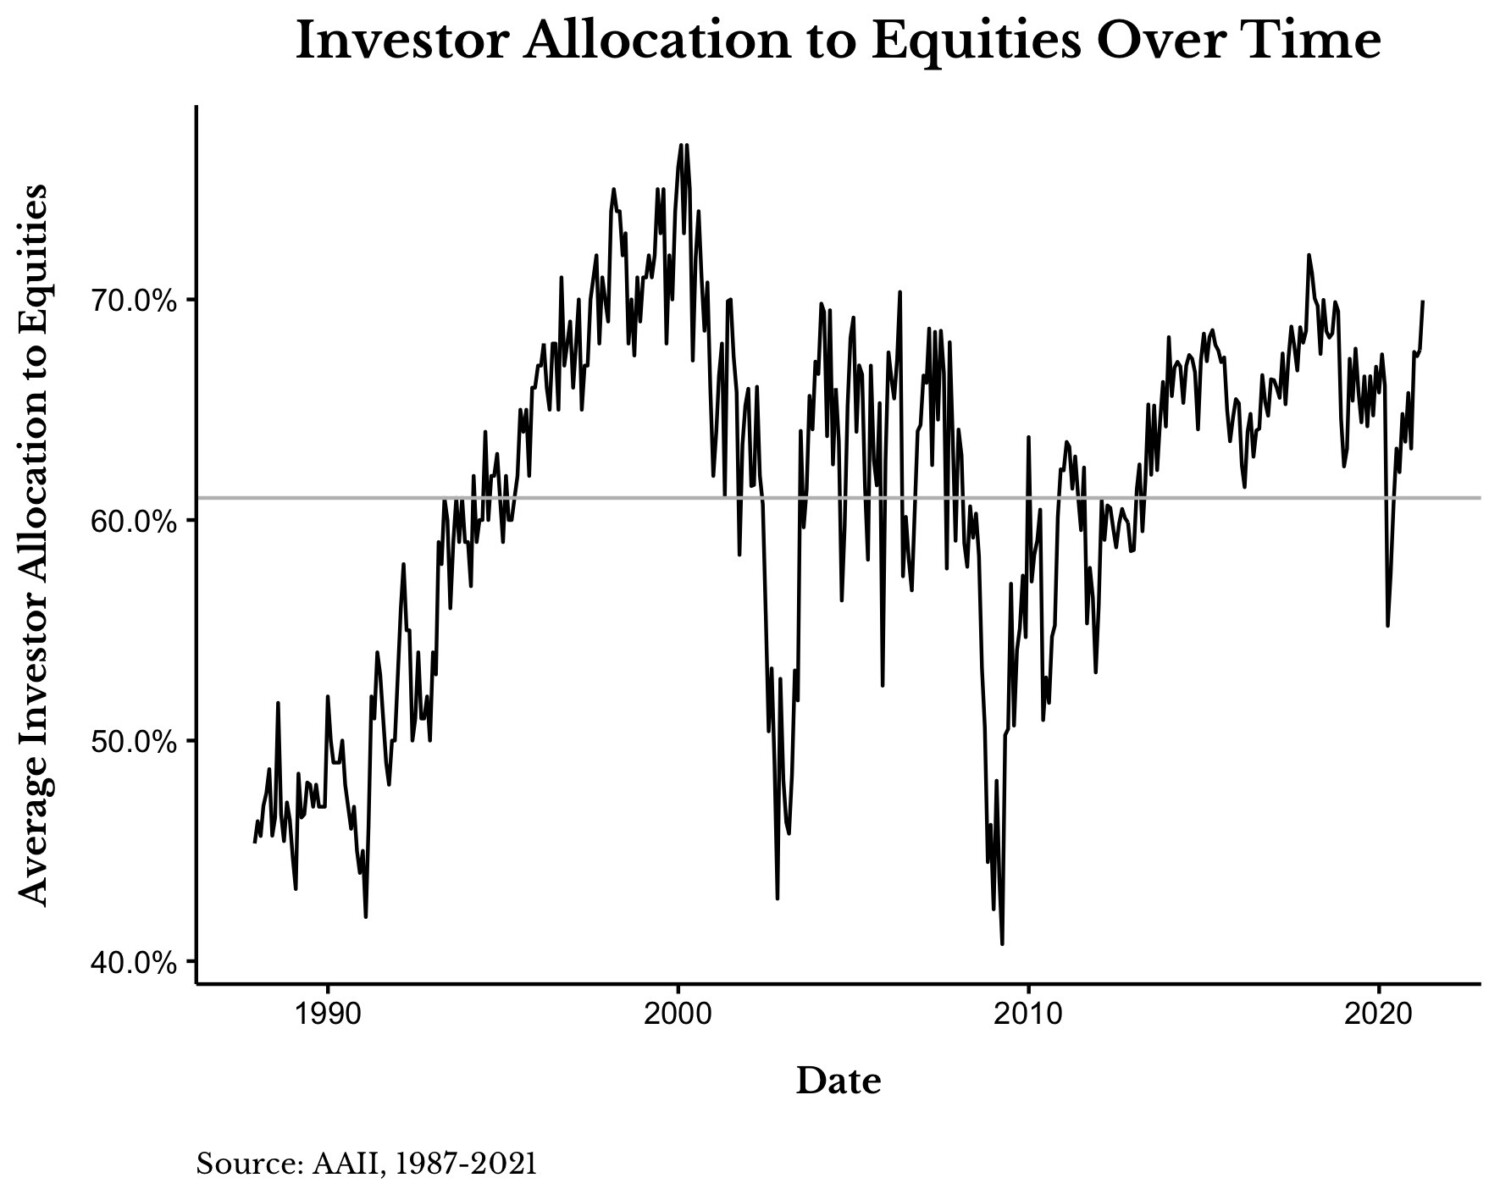
Like so many indicators, this one is useful only infrequently and at great extremes. In November 1987, right after one of the worst stock market crashes in history, equity was at 45% and cash was 35%. In January 2000, a few months before the dot-com crash, equities were 77% and cash was a mere 14%. At the lows of the financial crisis in March 2009, equities were 41% and cash was 45%.
One of the great tells that the pandemic-related crash in early 2020 did not end the bull market was that individual equity allocations never fell below 55.2% and cash never rose above 26.1%.
“Successful” Capital: A very different measure of dollar volumes are those dedicated to specific types of investments, such as venture capital, private equity, indexing, real estate or cryptocurrencies. Some see the large sums of money put to work in these areas as evidence of a bubble. This is an overly broad conclusion.
~~~
I originally published this at Bloomberg, April 12, 2021. All of my Bloomberg columns can be found here and here.
