Consumer Sentiment vs. Stock Market Returns

I am not a fan of most Sentiment readings. I don’t mean their current levels, but rather the way the entire complex gets used. This is not a new belief, but rather, a long-standing pet peeve.
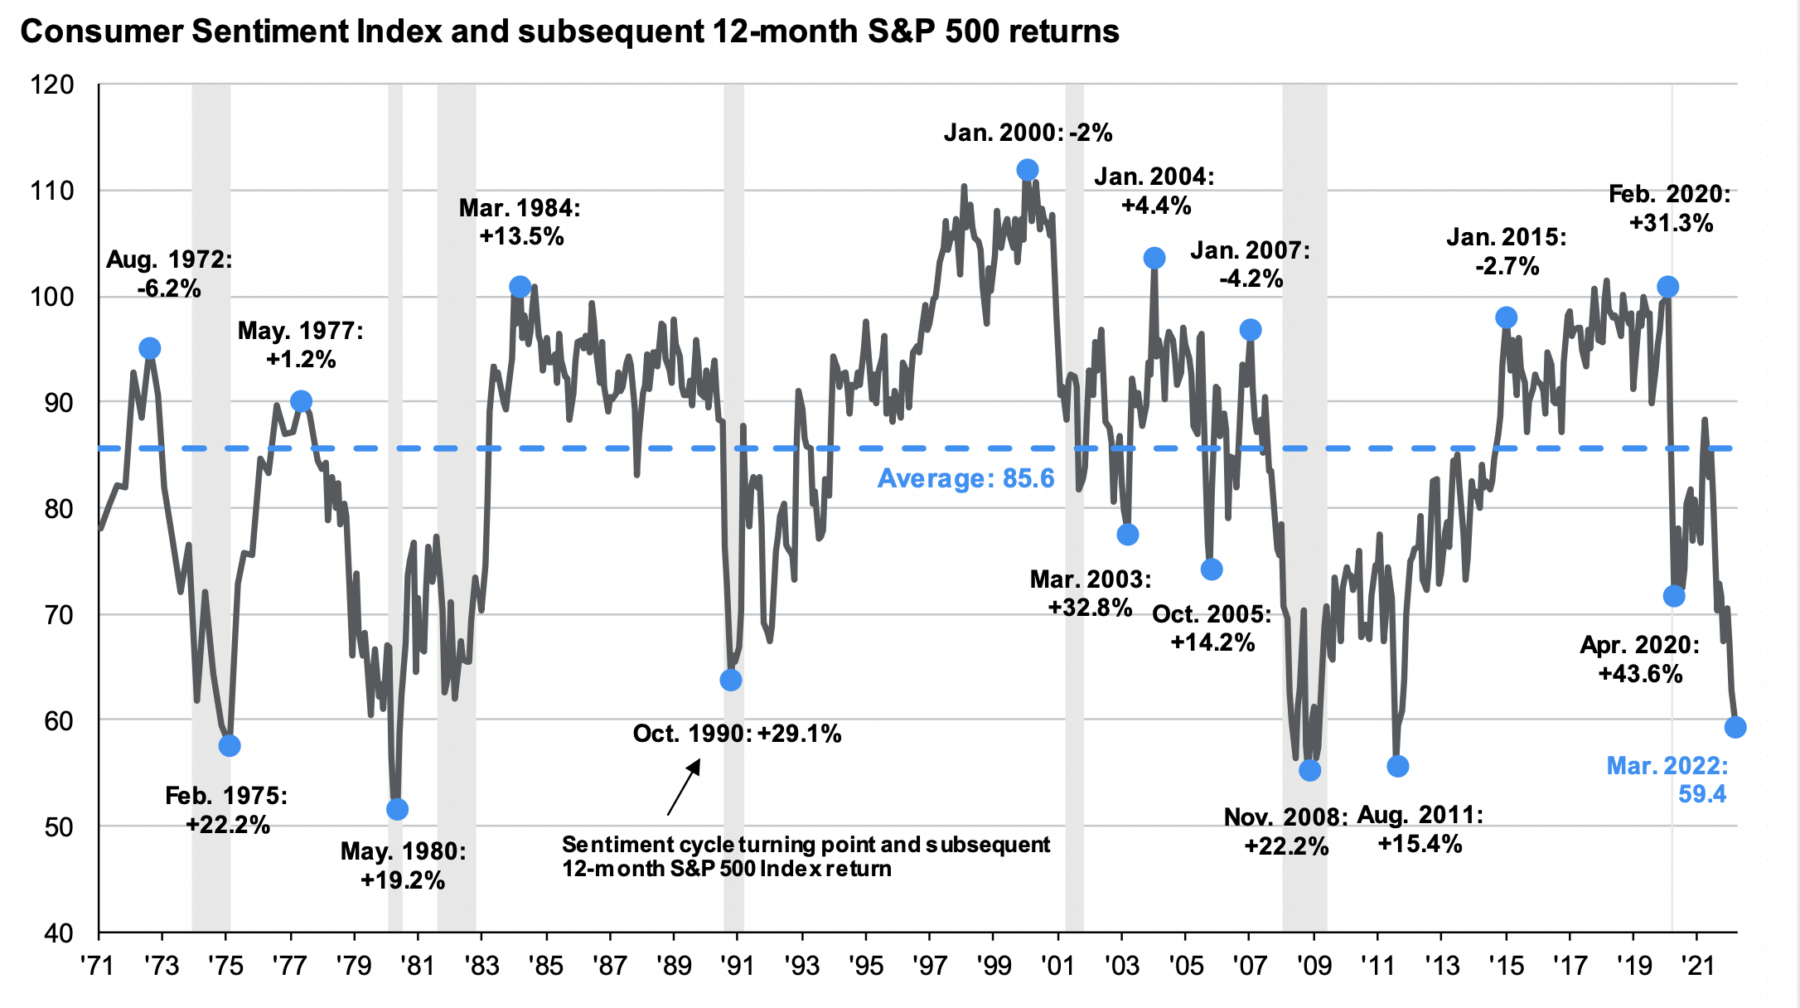
Sentiment readings can be fantastic contrary indicators, but they are rarely actionable, and then only when at extremes.
For example, if you want to use the Consumer Index as Buy signal, it has a good track record for the 5 or 6 signals it has generated over the past 50 years. I guess you could buy out of the money 1-year call options when the level drops below 60 (5 signals: 1975, 1980, 2008, 2011, and 2022) or 65 (1 signal: 1990). It’s good for a trade, but not much else.
There are a few people who can do this well, but they are few and far between.
UPDATE: May 17, 2022 5:51pm
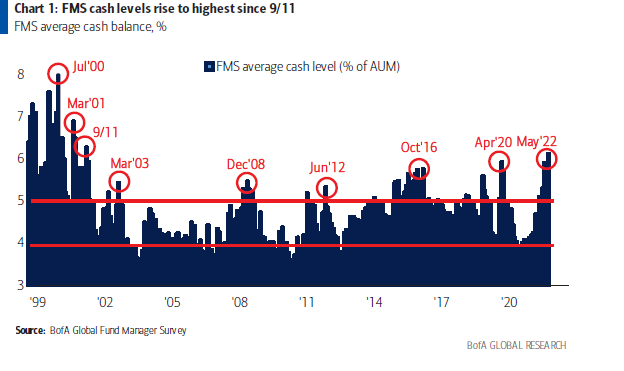
Two charts to add to this one: First, Tadas featured this Bank of America chart showing record-high levels of cash among their clients:
Referring to the same chart, Bloomberg noted:
“Cash levels among investors hit the highest level since September 2001, the report showed, with BofA describing the results as “extremely bearish.” This month’s survey of investors with $872 billion under management also showed that hawkish central banks are seen as the biggest risk, followed by a global recession, while stagflation fears have risen to the highest since 2008.”
And then coincidentally, Batnick & I also used the same sentiment chart (above)
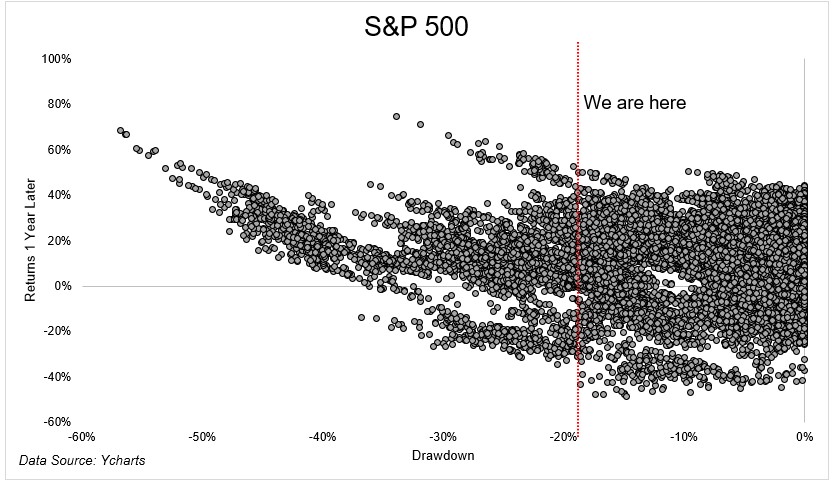
But he also created this chart to give you a sense of where we are in the market cycle.
“I went back to 1950 and looked at forward 1-year returns for the S&P 500 after a drawdown like the one we’re currently in. The average is 13% (9% in all periods) and was positive 86% of the time (74% of all periods). Not bad.”
See also:
Consumer Confidence and Stock Returns (Journal of Portfolio Management, 2003)
Previously:
Big Up Big Down Days (May 5, 2022)
Too Many Bears (May 3, 2022)
One-Sided Markets (September 29, 2021)
Source:
JPM Guide to Markets, 2Q 2022, March 31, 2022


