
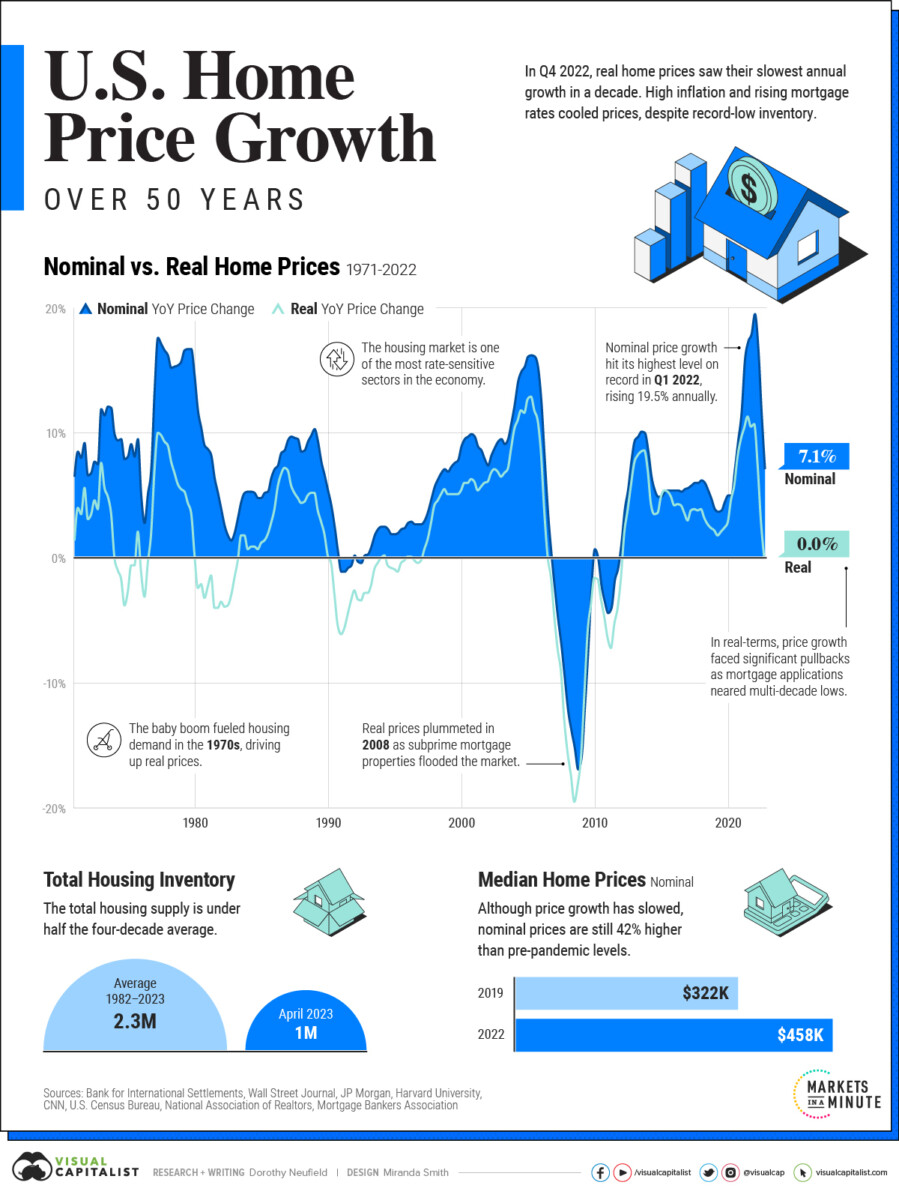
Fascinating chart from Visual Capitalist showing the history of housing prices in the United States.
I recall the 1990 Home Price recession — I was too broke to afford a condo, but I knew lots of recent grad school friends who took high-paying jobs and bought a place in the 1980s; more than a few were freaked out about falling prices.
The issue with rising prices is the ongoing shortage of single-family homes relative to both population and job locations. The miscalculation is part of the reason why prices have remained so elevated; add in a lot of people who might consider moving but don’t want to give up their 3 or 4% mortgages and you have a recipe for limited supply. This has led to elevated house prices and sticky inflated apartment prices (tho there are increasing signs that rental prices may have topped out).
Looking at prices since shows their concerns turned out to be somewhat misplaced. While hindsight is always 20/20, the chart reveals just how little we actually know what the future will bring.
Previously:
WFH vs RTO (February 16, 2023)
Can We Untie Real Estate and Employment? (March 21, 2022)
How Everybody Miscalculated Housing Demand (July 29, 2021)
