“I need the US Dollar to be a store of value between the time I make it until I spend it, invest it, pay my taxes with it, or give it away. It does that splendidly.” 1
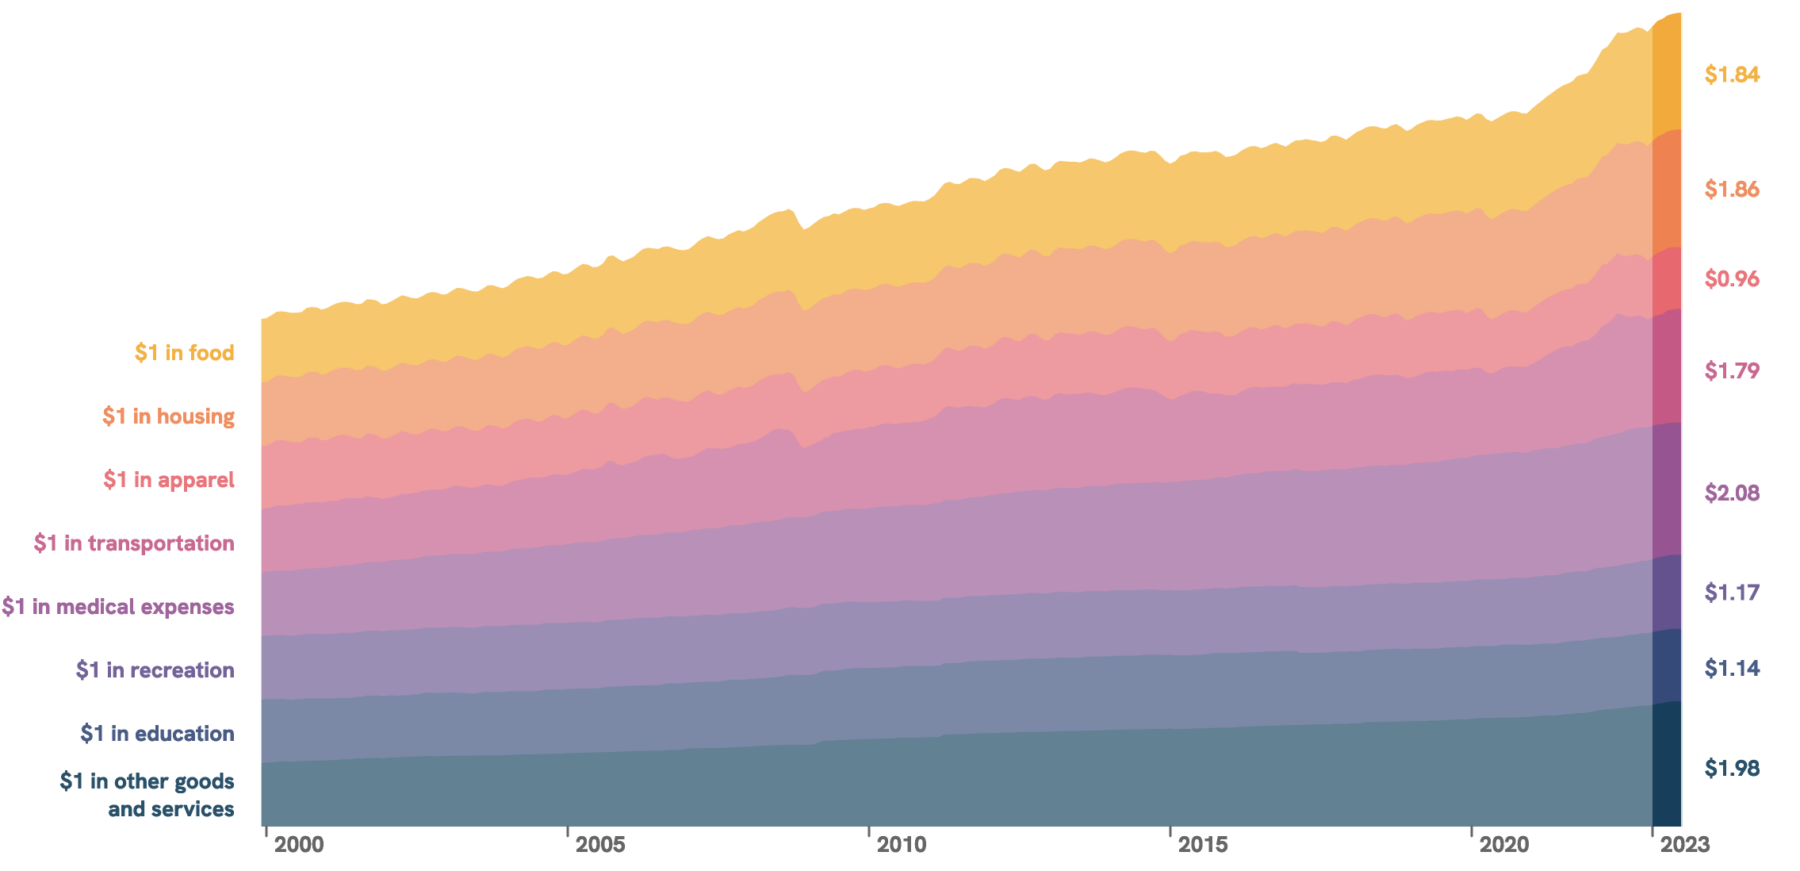
Today, we’re going to look at a perennial (un)favorite #chartfail. To be more precise, I want to discuss the type of chart that reflects a fundamental misunderstanding of the nature of money, currency, spending, investing, and taxes. I’ve mentioned this in the past, but I happened across the chart above, and it serves as a reminder to revisit this topic in greater detail.
You get paid in dollars. That compensation is in a currency that is a widely accepted medium of exchange.
As an example, I work 40-60 hours a week; I get paid for my time and efforts. That comp gets deposited directly into my bank account; that money is available for purchasing necessities (food, housing, clothing, medicine, transportation, etc.), discretionary spending (entertainment, travel, etc.), and for paying my taxes.
But that’s not all: I also have the opportunity to invest those dollars: I can buy a broad market index, patiently waiting for it to appreciate; I can buy bonds and enjoy the income they yield; I could purchase real estate, which either gives me a place to live or rent out for income; I could also use that money to start or build a business.
In each of those four categories, the dollars I invest will generate a return over time. And over the past few centuries, those returns have greatly exceeded inflation. And that’s the key misunderstanding of charts like the one above: It ignores is wildly inefficient relative to the time value of money.
Whether it’s a few decades or a century, the math works the same.
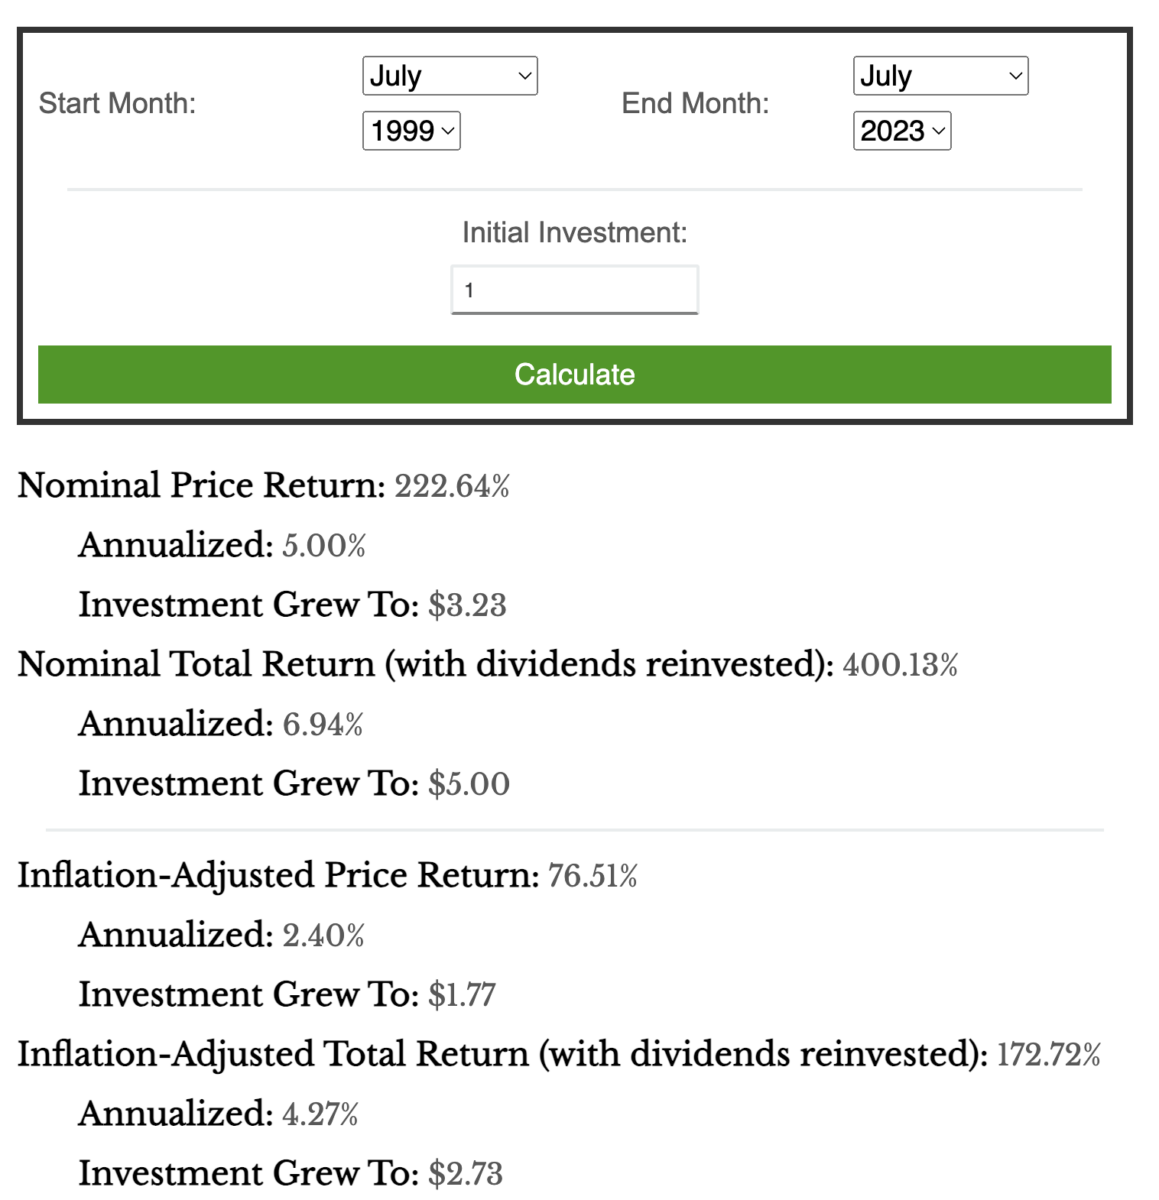
 Back to our colorful chart at top. Sure, it now takes $1.84 to buy that dollar of 1999 food. But had you put that into a simple investment like the S&P500 instead of holding the dollars, it would have grown at an annual rate of 6.94% per year and be worth about $5 dollars.2 You could buy those groceries and still have $3.16 left over.
Hey, what a very different outcome than suggesting a loss of purchasing power — if you understand money and math, you have actually gained purchasing power.
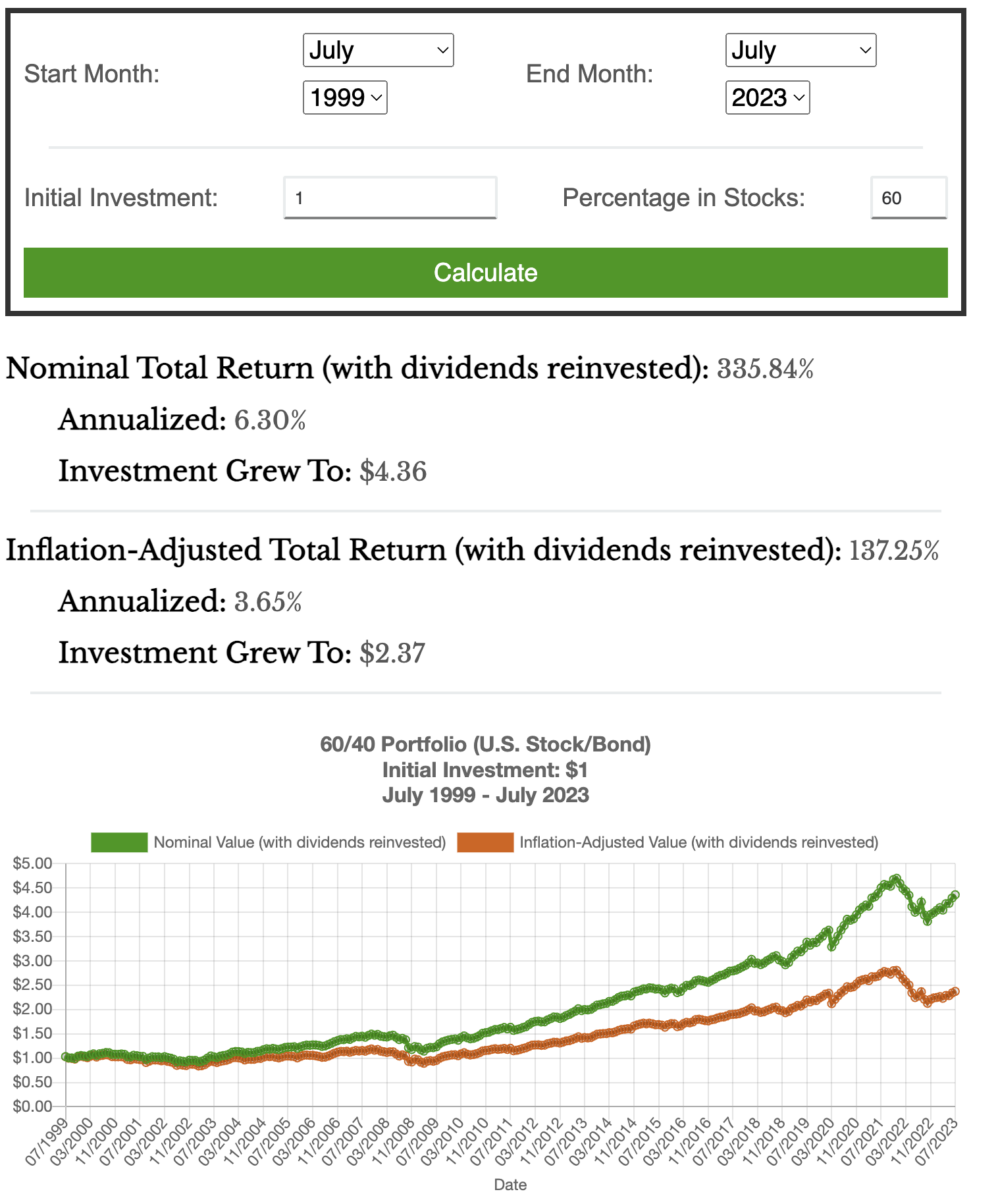
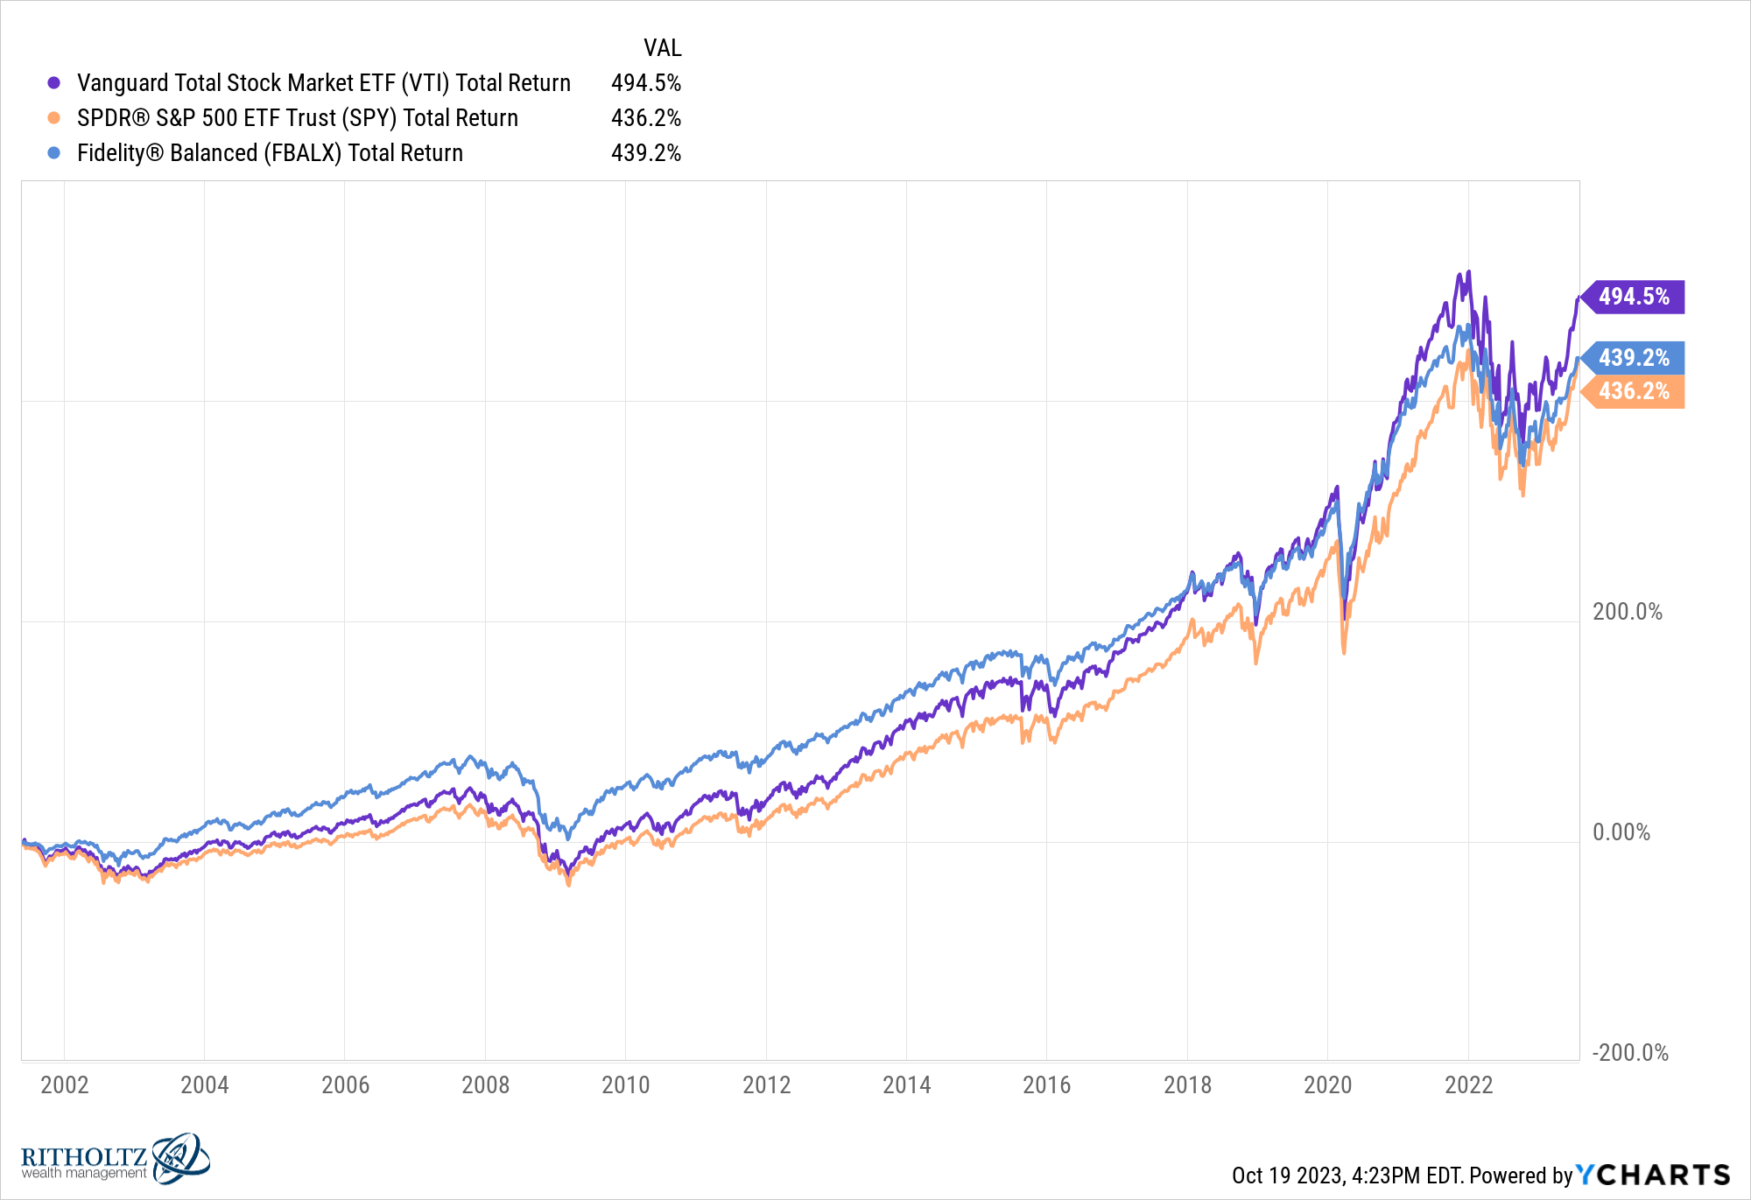
Instead of cherry-picking the S&P 500, what about a simple 60/40 portfolio (e.g., Fidelity Balanced Fund, FBALX)? You would have done slightly worse, gaining about 6.7% per year.3 And the Vanguard Total Market (VTI) would have done slightly better, garnering about 7.8% annually over the same period.4
I always dislike these one-sided arguments – Come see how much the dollar has depreciated over a century! At best, it’s denominator blindness; at worst, it’s purposefully misleading, ignorant, or full-blown Russian propaganda. All I do know is these are crap charts that reveal little other than their creator’s fundamental misunderstanding of finance.
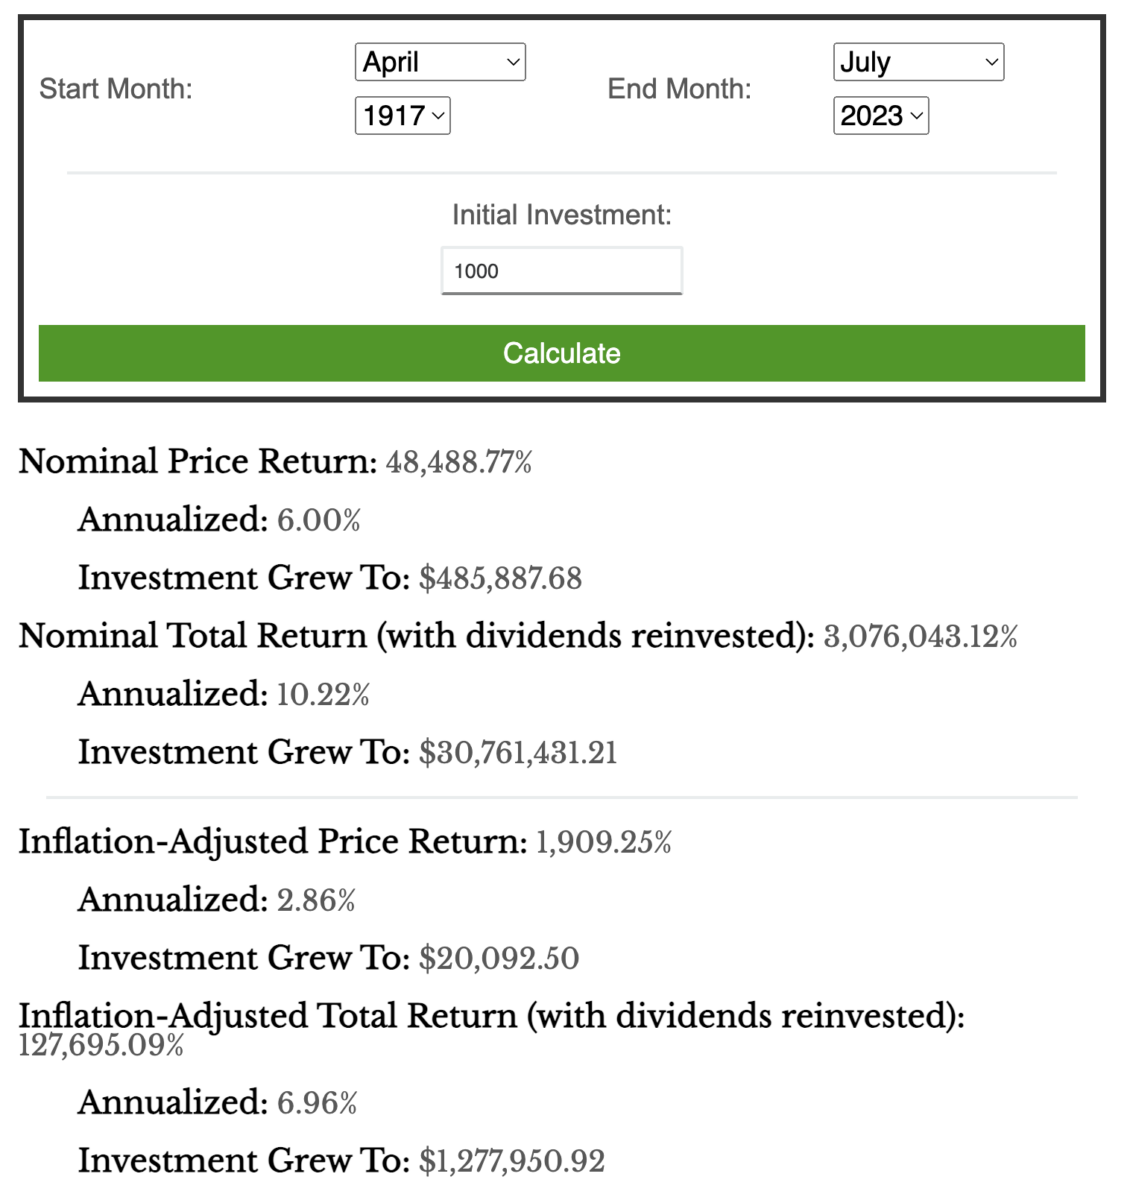
Let’s imagine two people, each with $1,000 dollars, getting ready to go off to World War I in April 1917. One decides to bury the cash in mason jars in the backyard, while the other sets up an account invested in the market (held in a trust in case they don’t return). Their descendants each take possession of these in July 2023. If it was your great-grandpappy who buried the cash, sorry, it’s now worth 96% less than April 1917. But if it was your ancestor who put that $1,000 into equities over that same period, well congratulations. Since then, markets have returned about 10.22% a year, and that small fortune grew to an enormous one,5 now worth over $30 million.6
You get paid in dollars, and you can and should use them for exchange. If you have to hold them for a few months, try a money market fund. For a year or two, an actively managed investment-grade bond fund is your best bet. For more than a few years, then it has to be equity, preferably a broad, cheap, passive index.
Currency like the U.S. Dollar is a medium of exchange, not a store of value. As such, they are never supposed to be left hanging around for years or decades — burying them for a century is just laughable…
Source:
How Far Does $1 From 1999 Go Today?
by Shri Khalpada
PerThirtySix, August 14, 2023
UPDATE December 13, 2023
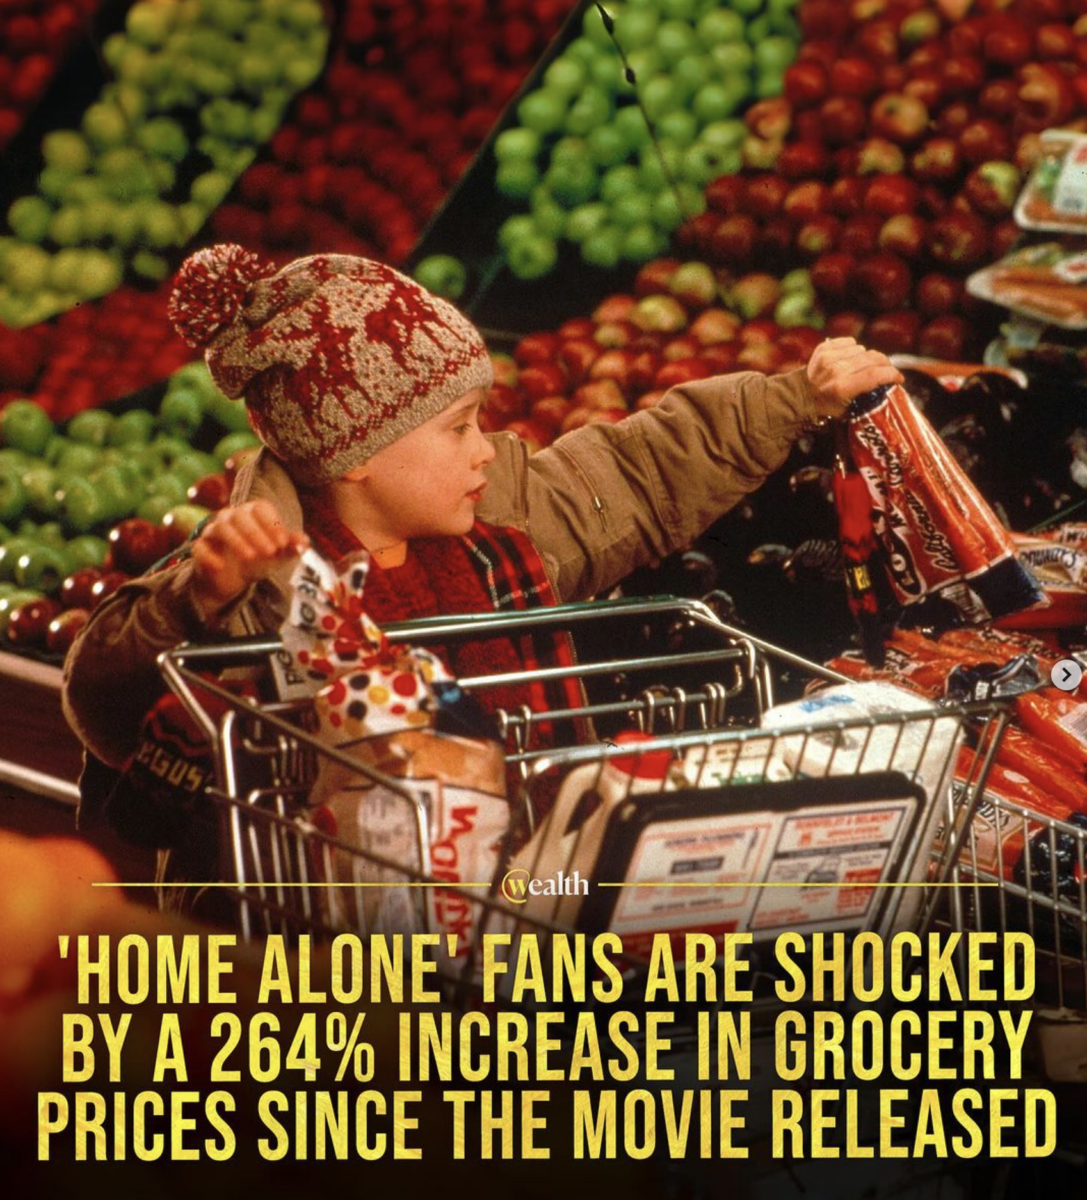
This silliness was found on an Instagram channel “Wealth“:
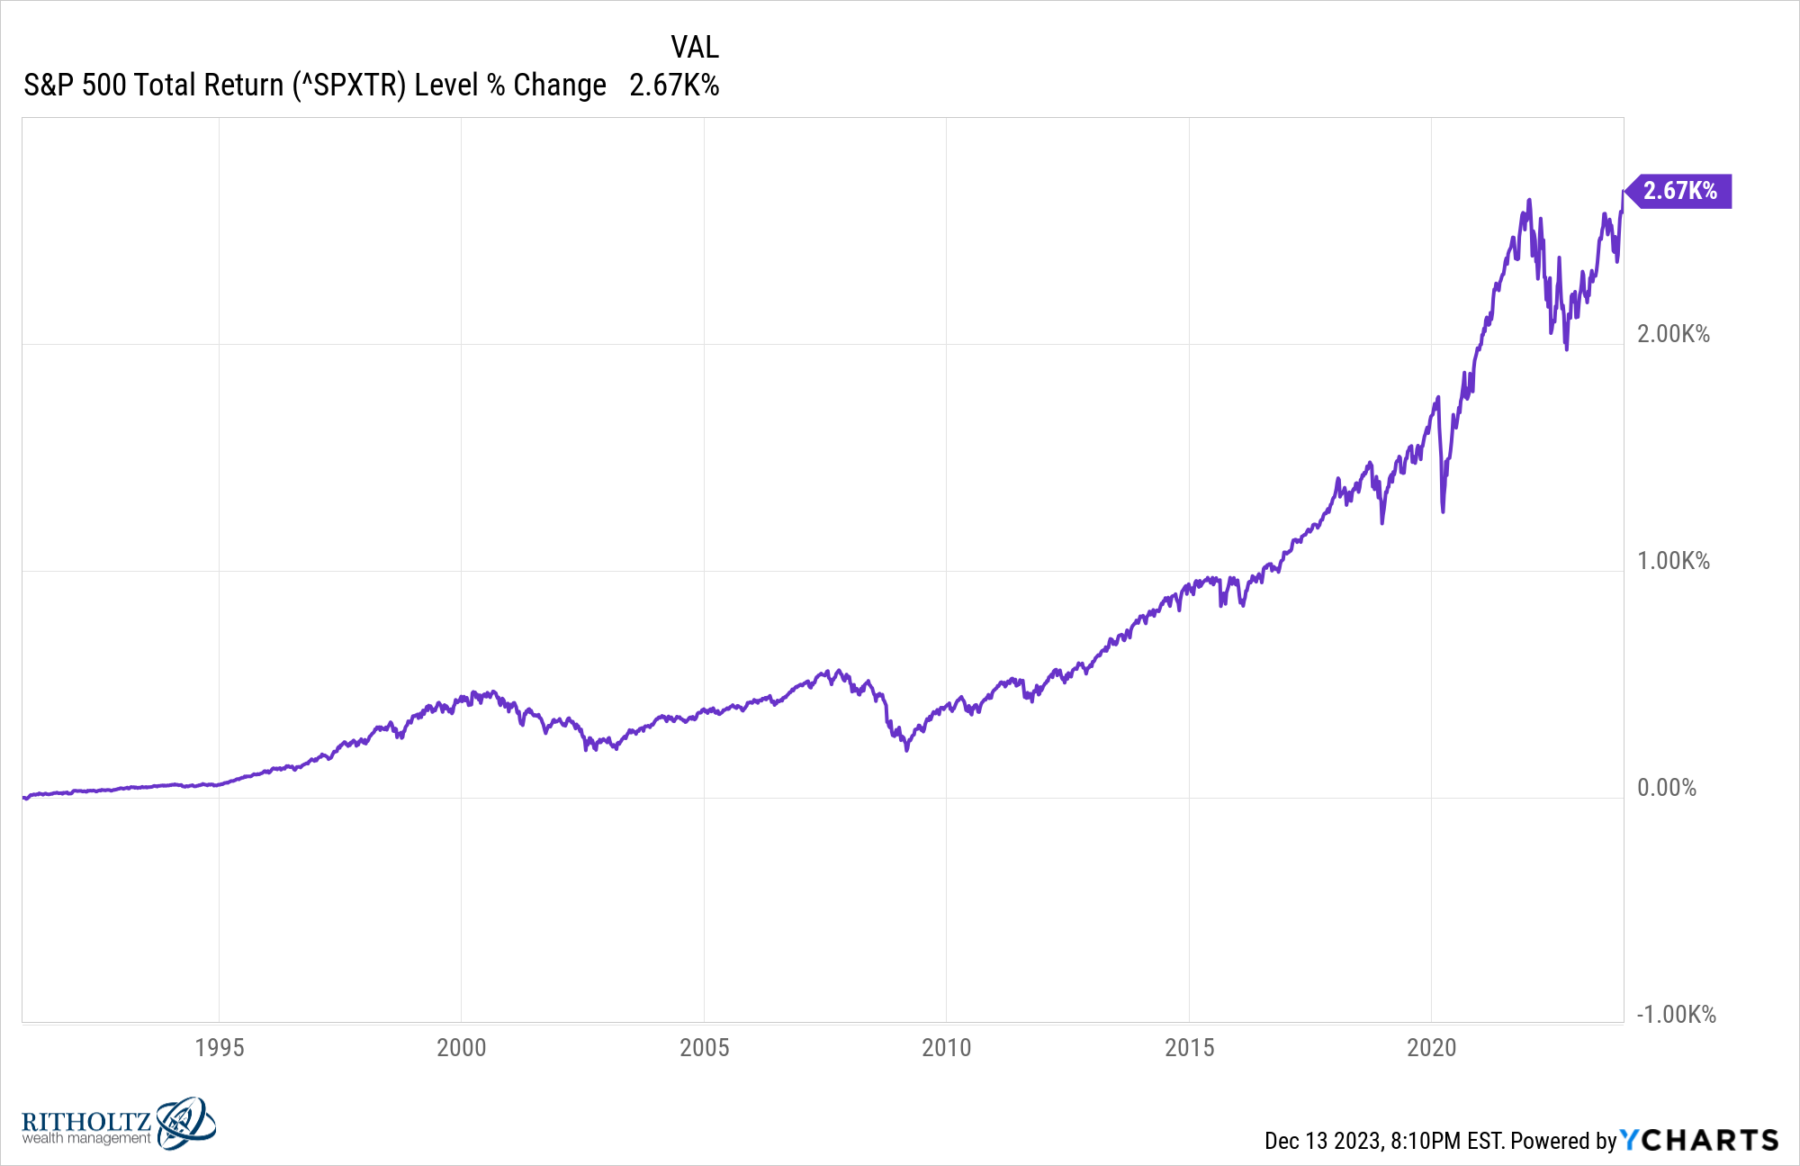
If “Home Alone” fans are shocked that grocery prices rose 264% since 1990, imagine how surprised they would be to learn that the S&P 500 was up 2670% over the same period…
__________
1. My Tweet from 10:33 AM · Oct 12, 2021
2. $1 in the S&P500 with dividends reinvested grew 6.94% annualized; over that 24-year period it would have grown to $5.00; data returns from Nick Maggiulli’s S&P 500 Historical Return Calculator [With Dividends]
3. $1 in the 60/40 portfolio with dividends reinvested grew at 6.30% annualized; over that 24-year period it would have grown to $4.36 ; data returns from Nick Maggiulli’s U.S. Stock/Bond Historical Return Calculator.
4. $1 in the Vanguard Total Stock Market ETF (VTI) with dividends reinvested grew 7.87% annualized; over that 24-year period, it would have grown to about $5.67.
5. $1,000 in the S&P500 with dividends reinvested would return 10.22% annualized, and from April 1917 to July 2023 would be worth $30,761,431.21; data returns from Nick Maggiulli’s S&P 500 Historical Return Calculator [With Dividends]
6. Returns over this long a period are exponential, and therefore not very intuitive.
A fun way to think about this is via the rule of 72. At 10.2%, annual returns, your $1,000 will double every ~7 years. Starting from 1917, that means the money has doubled 15 times:
| Year | Dollar Amount |
| 1917 | $1,000 |
| 1924 | $2,000 |
| 1931 | $4,000 |
| 1938 | $8,000 |
| 1945 | $16,000 |
| 1952 | $32,000 |
| 1959 | $64,000 |
| 1966 | $128,000 |
| 1973 | $256,000 |
| 1980 | $512,000 |
| 1987 | $1,024,000 |
| 1994 | $2,048,000 |
| 2001 | $4,096,000 |
| 2008 | $8,192,000 |
| 2015 | $16,384,000 |
| 2022 | $32,768,000 |
Pretty incredible, huh?
Matching the above 1999 inflation chart:
S&P500 Returns, July 1999 to July 2023
60/40 Returns, July 1999 to July 2023