
Sometimes, the data is so overwhelming that little commentary is needed.
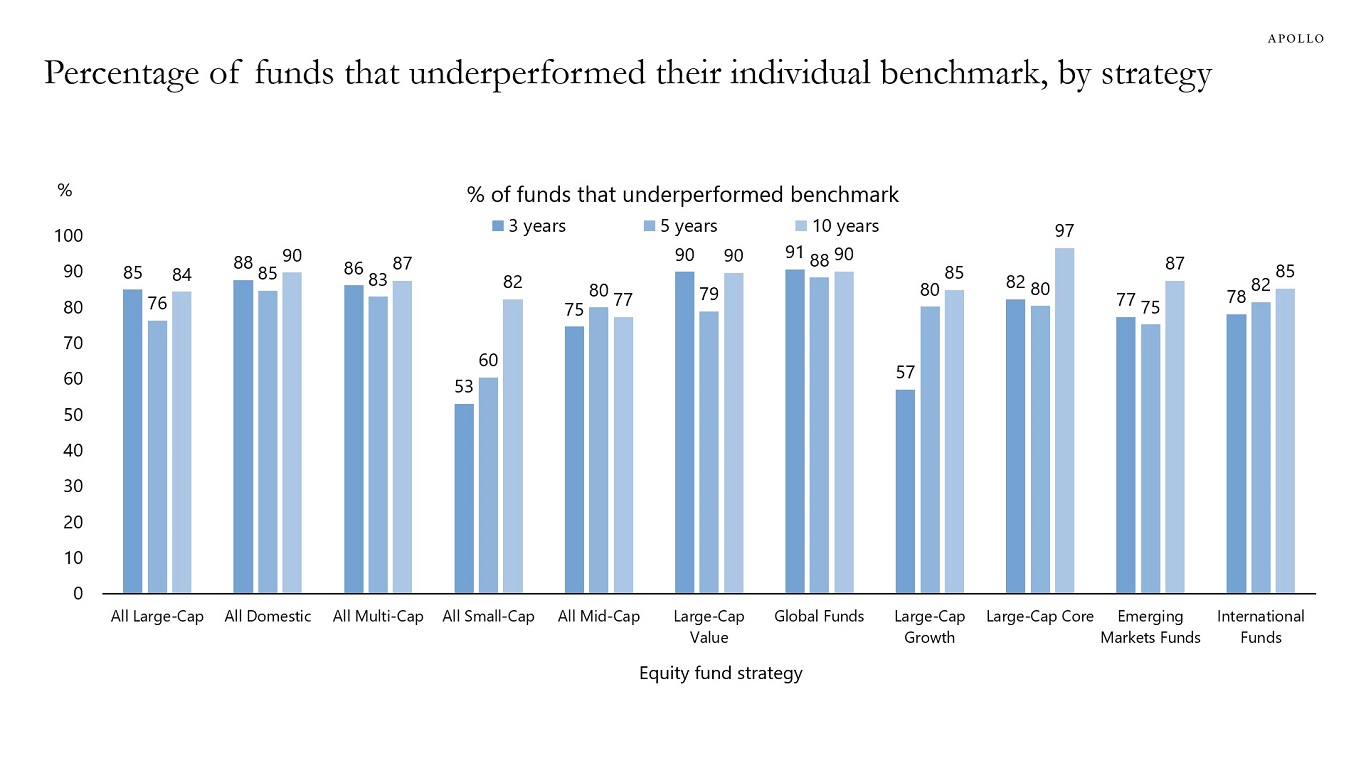
From SPIVA, here is the data on large-cap fund performance in the United States, showing the percentage of all large-cap funds that over and underperformed the S&P 500 over various time frames:
1 Year: 65.24% of funds underperformed the S&P 500; 34.76% outperformed the S&P 500
3 Years: 84.96% underperformed; 15.04% outperformed
5 Years: 76.26% underperformed; 23.74% outperformed
10 Years: 84.34% underperformed; 15.66% outperformed
15 Years: 89.50% underperformed; 10.50% outperformed
After 15 years, the odds are about 1 in 10 that you have picked an active fund that has outperformed its benchmark over that period. (All data as of Dec 31, 2024) And, if we go out to 20+ years, practically nobody net of fees has beaten their benchmark.
And it’s not just the U.S. SPIVA reports similar data for Europe, Japan, Canada, Mexico, Brazil, Chile, Middle East, S. Africa, and Australia.
The probabilities make it clear that a broad index should be the core of your portfolio; if you want to put your own spin on it, feel free to try. But the key takeaway remains this:
Portfolios cannot achieve Alpha if they are not at least getting out with Beta.
~~~
Do you need help with your assets? RWM works with clients by constructing a long-term financial plan, marrying it to an appropriate level of risk in a broadly diversified portfolio built around a core index, and then applying the best technology we can find to generate net after-tax returns with modest risk and volatility.
Reach out to us at info@ritholtzwealth.com for more information…
Sources:
More Than 80% of Active Managers in Public Markets Underperform Their Index
Torsten Sløk,
Apollo, May 29, 2025
United States Percentage of All Large-Cap funds vs S&P 500
SPIVA Research
