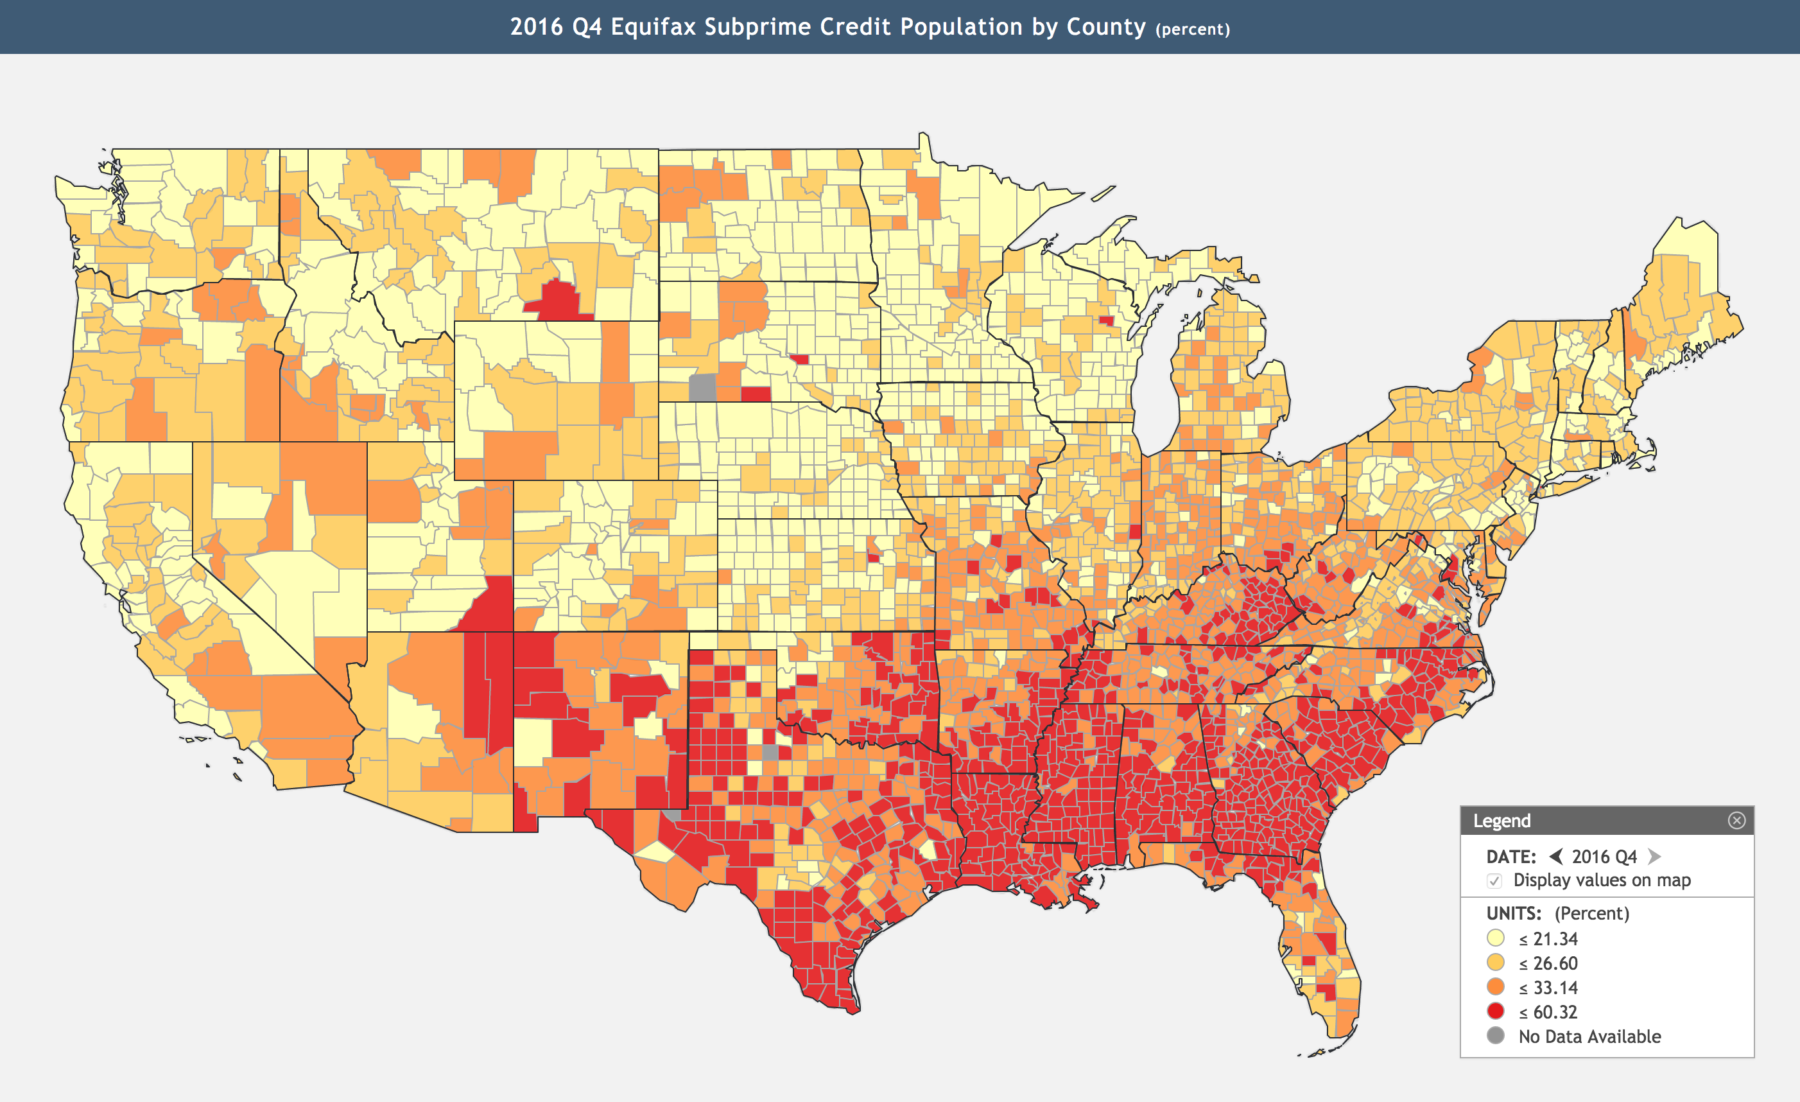
 Interesting look at the two economic elements by county: 2016 Q4 Equifax Subprime Credit Population by County (percent) ...
Read More
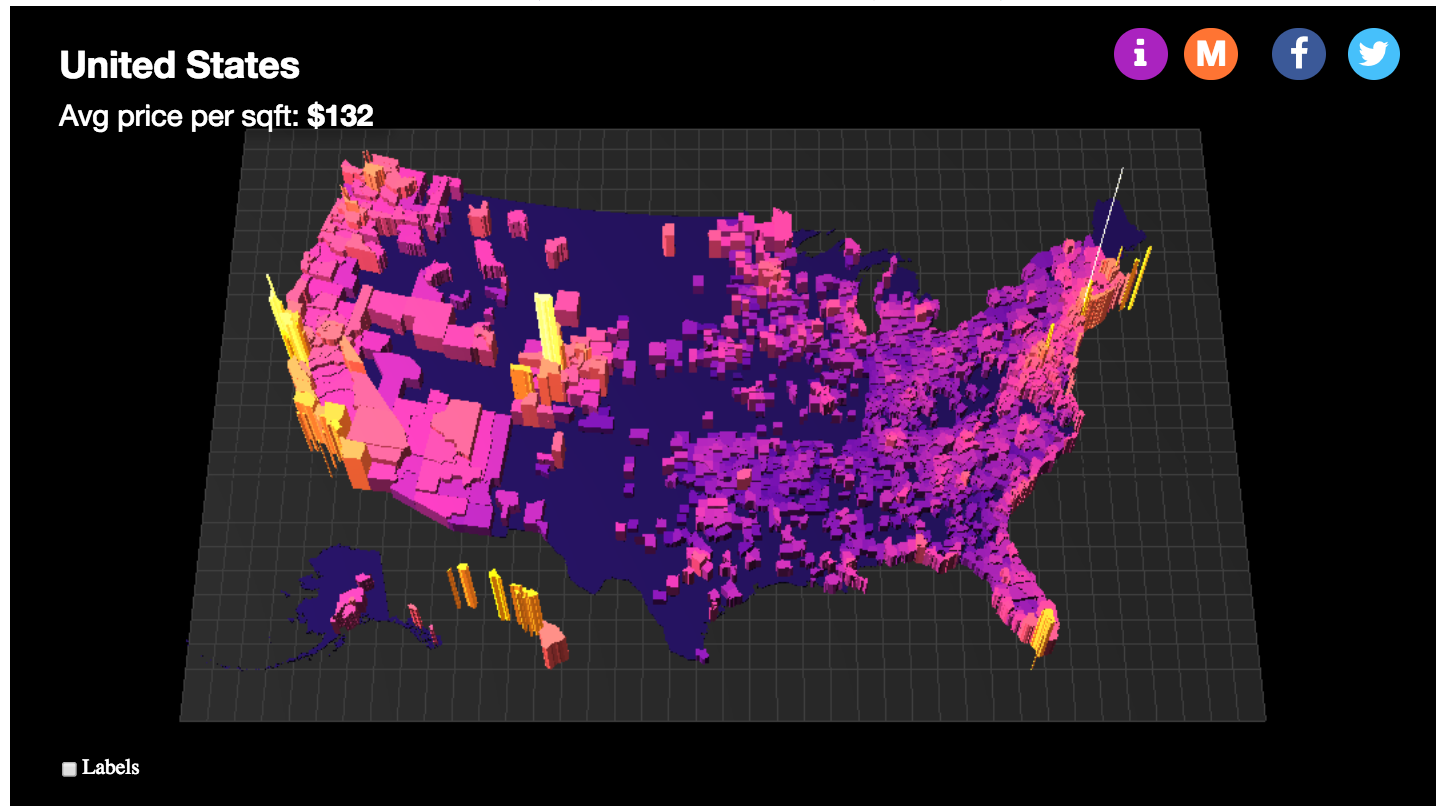 3D Map Shows the Price Per Square Foot of U.S. Housing Markets Click for the interactive graphic. Source: Visual Capitalist
Read More
 What is going on New Zealand? I guess the Lord of the Rings movies changed them . . . Source: The Economist
Read More
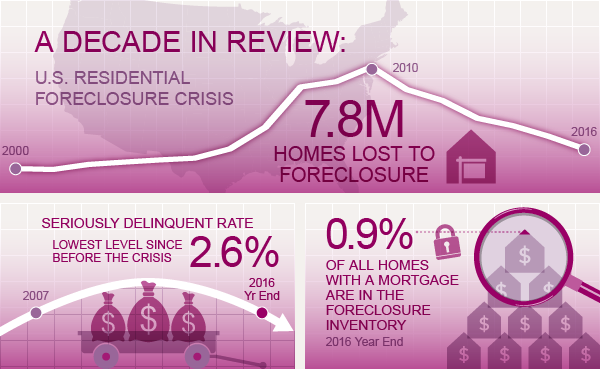 Comprehensive data and analysis on completed U.S. foreclosures and foreclosure inventory: Fascinating report from Core Logic on the past...
Read More
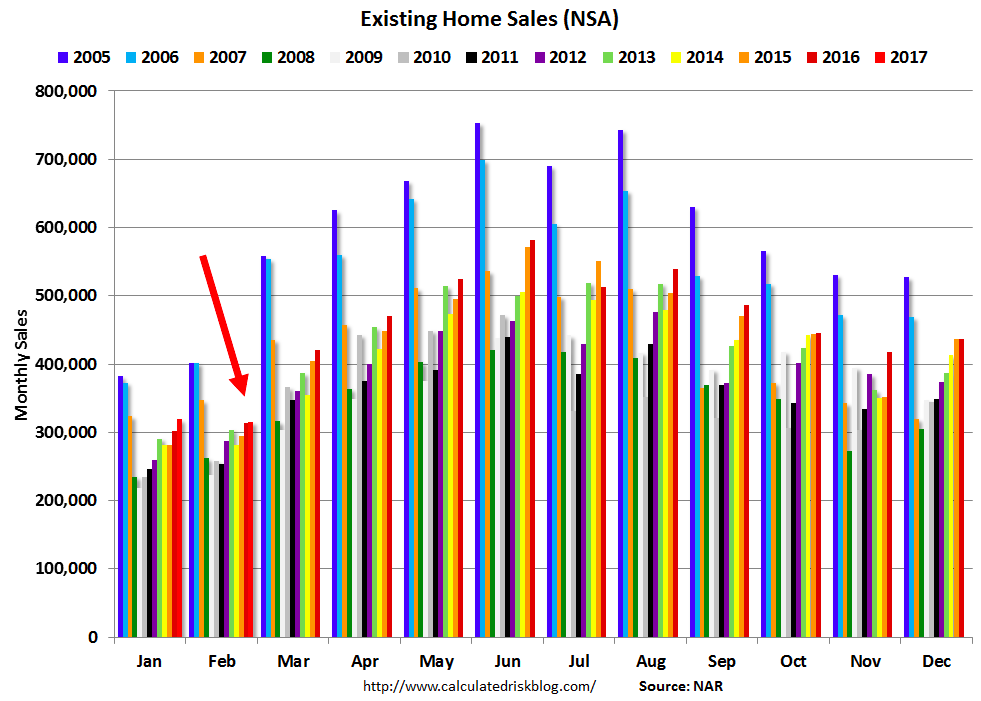 click for ginormous graphic Source: Calculated Risk During the real estate bust — call it 2006 to 2010 — this was my...
Read More
Really fascinating: Hat tip Jonathan Miller
Read More
 A Close Look at the Decline of Homeownership Andrew Haughwout, Richard Peach, and Joseph Tracy Liberty Street Economics, February 17,...
Read More
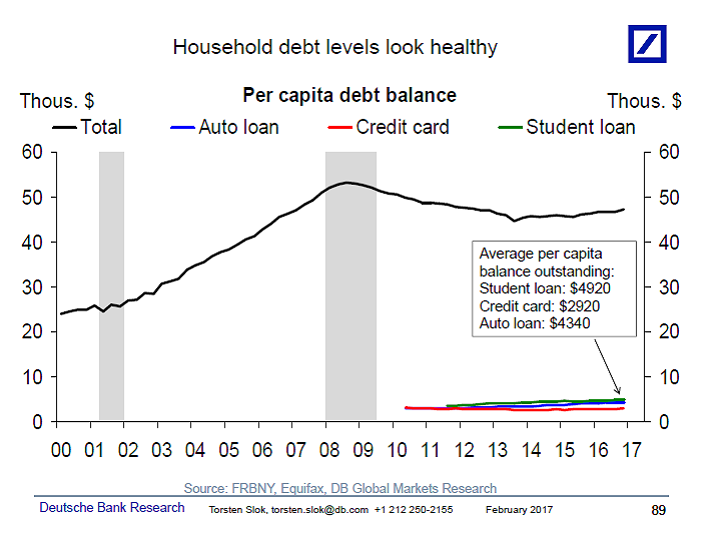 From Torsten Sløk, Ph.D.: Per capita debt levels have moved essentially sideways over the past decade, see chart below, and student...
Read More
 The Evolution of Home Equity Ownership Andreas Fuster, Eilidh Geddes, and Andrew Haughwout Liberty Street Economics, FEB 15, 2017 ...
Read More
 The Evolution of Home Equity Ownership Andreas Fuster, Eilidh Geddes, and Andrew Haughwout Liberty Street Economics, FEBRUARY 14, 2017...
Read More
 Interesting look at the two economic elements by county: 2016 Q4 Equifax Subprime Credit Population by County (percent) ...
 Interesting look at the two economic elements by county: 2016 Q4 Equifax Subprime Credit Population by County (percent) ...


