Pick Another Day to Celebrate the Bull Market’s Birthday
Yes, the lows were on this day in March 2009. But the next four years were just the recovery from a huge collapse.
Bloomberg, March 9, 2018
On this day in 2009, the major stock-market indexes closed at lows not seen in more than a decade.
Although we now know this was the bear-market bottom, we only know that with the benefit of hindsight. At the time, few people could say with conviction that this low point was the low.
On this anniversary of that bottom, I want to look at why bear market recoveries and bull markets are so very different and distinct. This is especially true if you consider factors such as price, trend, value and investor psychology. Confusing the two is a potentially expensive error.
The gains since the 2009 low have been impressive. The Standard & Poor’s 500 Index is up 311 percent, or 16.7 percent on an annualized basis. If we include dividends, the gain is 385 percent, or 19.2 percent annualized. The value of U.S. equities has increased by $25.6 trillion during this nine-year period.
Yet looking at these spectacular gains from the lows until now creates a very misleading picture. It ignores the collective psychology of the time — lots of investors back in March 2009 were sellers, not buyers. Indeed, that panicked selling — I surrender! — is how market bottoms get made.
I won’t show you that misleading chart from March 2009 until present, as it leads to two specific investor errors. Instead, I want to give you some context, the bigger picture, to help you grasp what actually was going on.
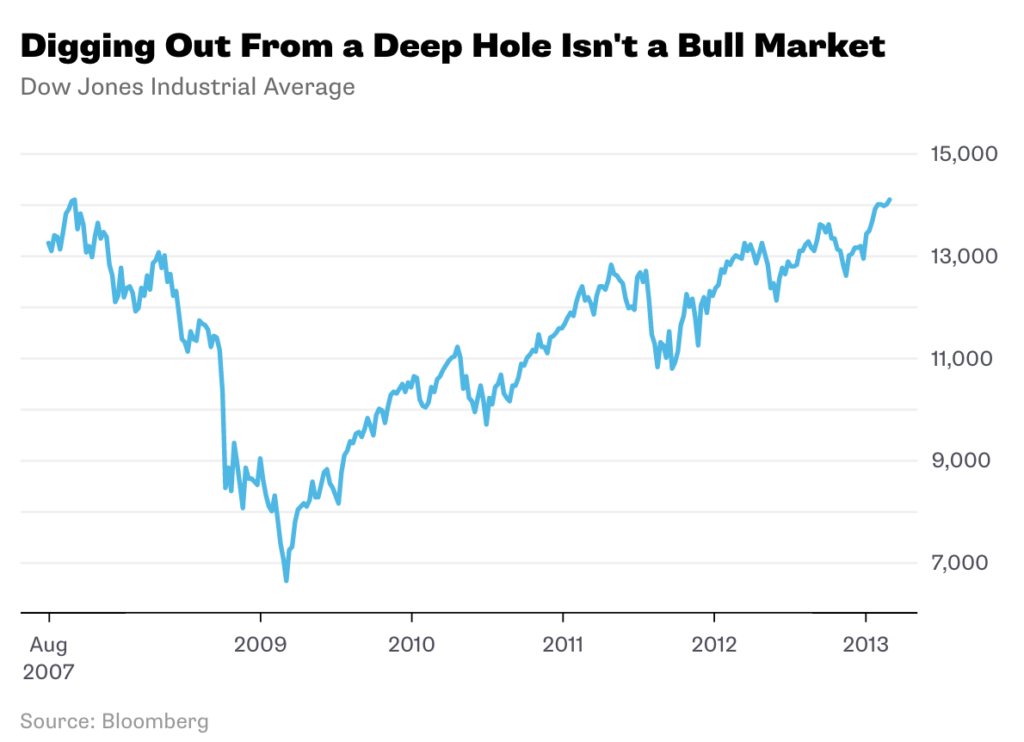
Let’s begin with the terrifying drop in markets that preceded that bear-market bottom. U.S. indexes fell 57 percent in just 18 months — from the highs in October 2007 to those March 2009 lows. That is a very fast, very steep drop. Much of the rally from lows was merely a recovery after that collapse. March 2009 isn’t a birthday, but rather when the patient left the intensive care unit and was moved to a recovery room.
The chart below illustrates the high, the collapse and the recovery. Indeed, the gain from March 2009 to February 2013 was simply the market climbing back from the losses. To call that period a new bull market flies in the face of everything we know about how investors and markets behave.
At the time a new low is reached, traders and investors have no idea if any given low is the low. It is only after the fact that you can look at the price action and declare a bottom. This is why bull markets are dated by technicians when broad indexes like the Nasdaq, S&P 500 or the Dow break out of their prior trading range to make new highs. As we have discussed before (see this, this, and this), this is why the right way to date the start of the new bull market is about March 2013.
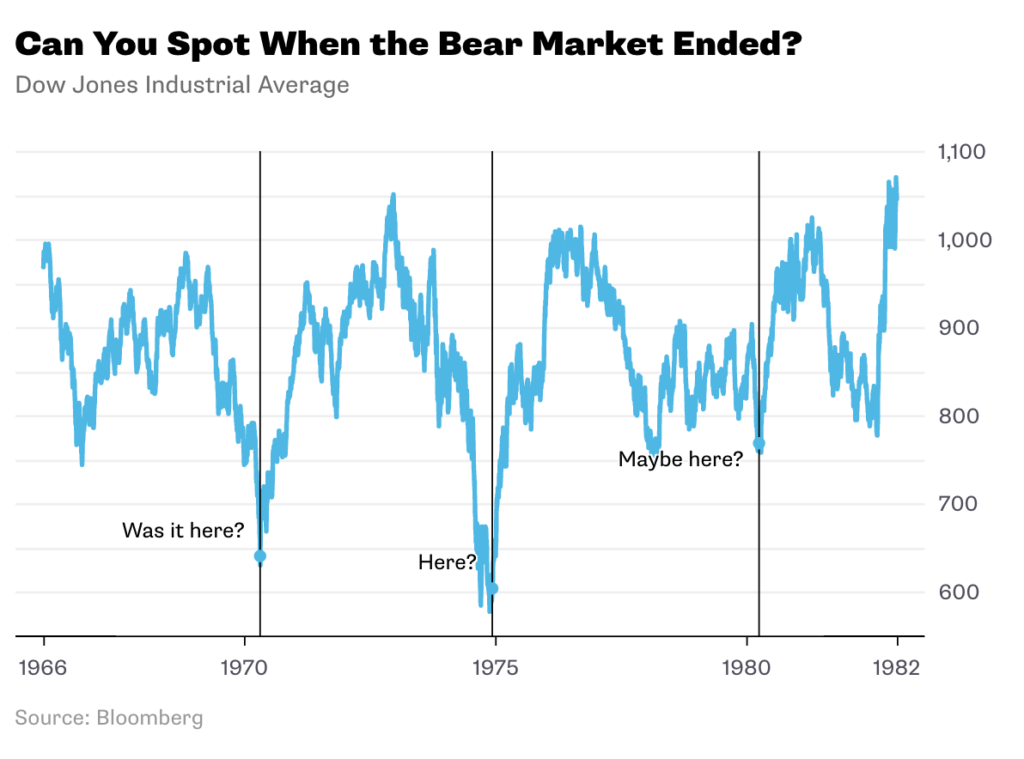
Now consider what it must have been like to be a trader during the period from 1966 to 1982. That was one of the all-time classic bear markets, characterized by high inflation, high unemployment, high Treasury yields and rising inflation — as well as strong rallies followed by sharp selloffs. As the chart below should make clear, nobody trading at the time had any real idea what was going to happen in the markets.
To students of market history, March 2009 could have easily been mistaken for December 1974 (see this), which looked like the start of something good before sputtering out.
The question during the 1970s was always whether a rally was going to stick or fall apart; none of the rallies held up, except the very last one in the early 1980s. In retrospect we now know that this period was simply one long, range-bound bear market that couldn’t be declared over until new market highs were made.
This is why we don’t date the start of bull markets until those new highs get reached. You obviously cannot have a new bull market begin until the prior bear market ends, and until those new highs get made, there is a lack of convincing evidence.
Those people who date the bull market to March 2009 are using the benefit of information that was not available to traders then. Telling someone after the fact when they should have bought and sold is a useless exercise. On the other hand, you should recognize the breakout to new highs and that a new trading range has been established. This was the case in 1982 and again in 2013. That wasn’t the case in 1974, and back in 2009 no one could be sure if the rebound was simply a bounce off the bottom or the setup for determined move higher. We now know the latter was the case.
One other point needs to be addressed: Over and over I hear people declaring that the bull market is aging and risky. I heard this line of argument in 2011, 2012, 2013 — and it’s still being made, with investing sages telling people to sell stock and hold more cash. Instead, of course, investors who have been buyers at those supposedly unsustainable market highs have done rather well for themselves.
This is why it is important to properly date the start of a bull market. Using the wrong starting point can lead to costly investment mistakes.
~~~
I originally published this at Bloomberg, March 9, 2018. All of my Bloomberg columns can be found here and here.


