
click for ginormous chart
Source: RWM, Bloomberg
There are many reasons why I believe you should not date bull markets from the prior bear market lows. But two reasons standout in particular.
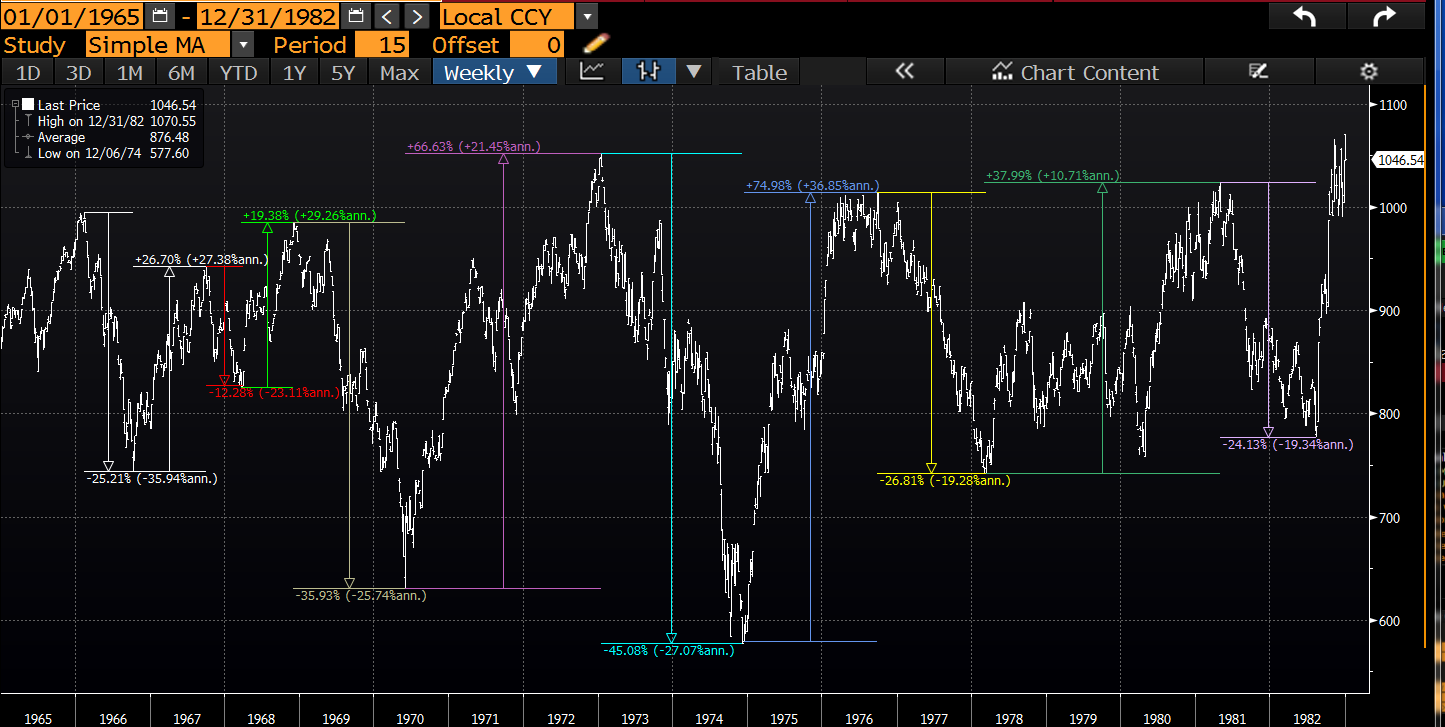
The first is hindsight: Consider what it was like during the 1970s bear market. There were multiple rallies and sell offs – down 25.2%, up 26.7%, down 12.3%, up 19.4%, down 35.9%, up 66.6%, down 45.0%, up 75.0%, down 26.8%, up 38.0%, down 24.1%. Anyone claiming they knew during the market moves that the bear was over is lying to themselves and anyone else within earshot.
1974 and 2009 were very similar within that longer cycle. To students of market history, March 2009 was very parallel to 1974 in May 2009 (see this); so too did that 16-year trading range look similar to the 2000-2013 period.
It is only with hindsight that we know all of those rallies were cyclical, not secular. And, we know which were the bear market bottoms that held and which did not only after the fact.
The second reason: new highs are actionable. The breakout in 1982 or 2013 is a trade you can confidently make.
More on this shortly . . . (here)
