
Seeing the market crash from a few weeks ago, it is clear how quickly the market can ferociously hurdle in front of one’s risk models. Risk models that failed to safeguard against risk when it mattered the most. Models that left many large hedge funds hemorrhaging – top funds which by definition were supposed to protect their investors in the August tumult. Instead when markets broke bad, a lot of things “went wrong”; and stayed that way. In this article, we explore a number of the large U.S. market crashes since the mid-20th century, and show how the recent bust compares. We learn why relying on risk models whose approximations presume to work consecutively at all times, can lead to failure. The key for investors (if they must be active) is to always remain vigilant. Professor Nassim Taleb recently expressed it nicely:The *only* way to survive is to panic & overreact early, particularly [as] those who “don’t panic” end up panicking & overreacting late.
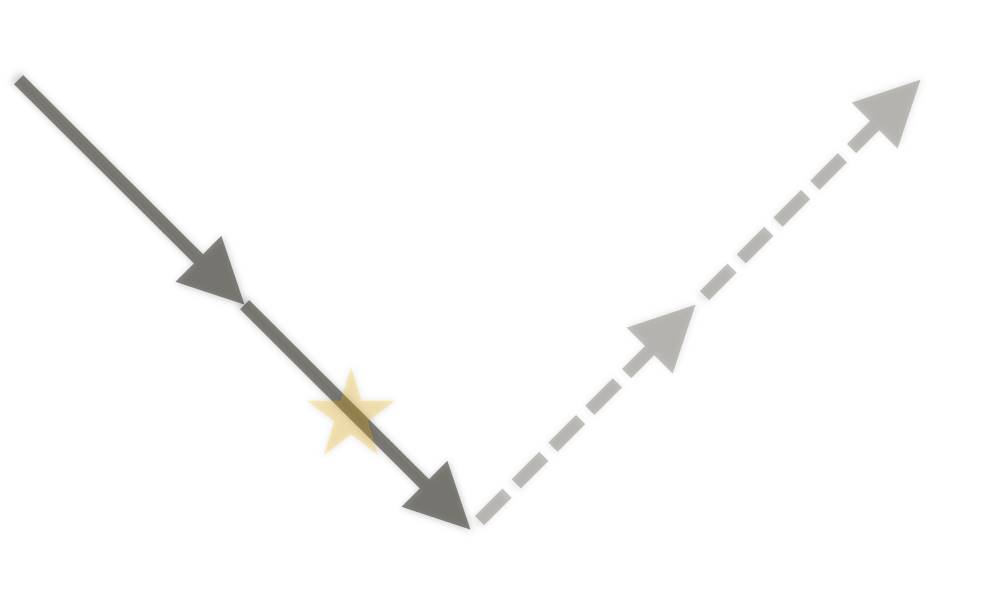
And there were many who wound up in panic in recent weeks. Selling under record volume on August 24 (China’s Black Monday). Let’s first consider what an overall market crash look like. We quickly show a symmetrical V-shaped illustration here. This illustration also shows a rise in fear on the way down, with peak panic near the bottom (the orange star), then followed by up-moves that mirror the previous down-moves. We will need to review this overall shape in a future article. But for now we discuss simply the left side of the illustration (the solid brown down-arrows).
In developing upon the numerous ways in which a market crash can occur, we apply a non-parametric probability approach that explores an initial brutal decline. Then a peak in market fear, and then an “aftermath”. We’ll also tabulate and focus our attention on 10 largest crashes since 1950. Each one we measure up against these 3 crash patterns below.
Of course we can debate to some extent over what the 10 largest crashes are, but that would be losing the forest through the trees. It’s more important that we simply agree on a respectable overlap of what constitutes a decent sample of market busts, and when the peak jitters were felt by investors and observants. Now for fun, which of the following 3 patterns do you think generally represents the nature of these large crashes?


September 26, 1955:
May 28, 1962:
October 19, 1987 (my birthday):
October 13, 1989:

October 27, 1997:
August 31, 1998:

April 14, 2000:

October 15, 2008:

August 8, 2011:
August 24, 2015:
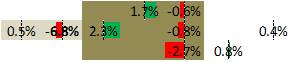
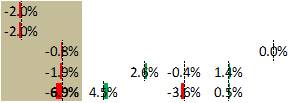
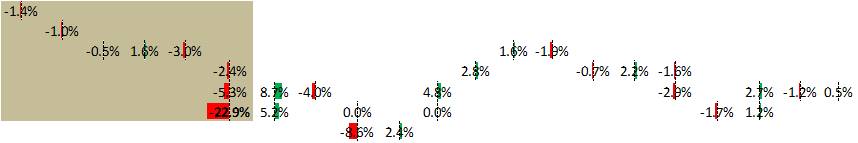
August 21 +0.9%
August 22 +0.8% (positive price move though less severe versus +0.9% so shift up and to the right)
August 23 -0.1% (negative price move is a directional change so shift to the right)
August 26 -5.5% (negative price move and more severe versus -0.1% so just show it vertically below the August 23 result)
Etc.
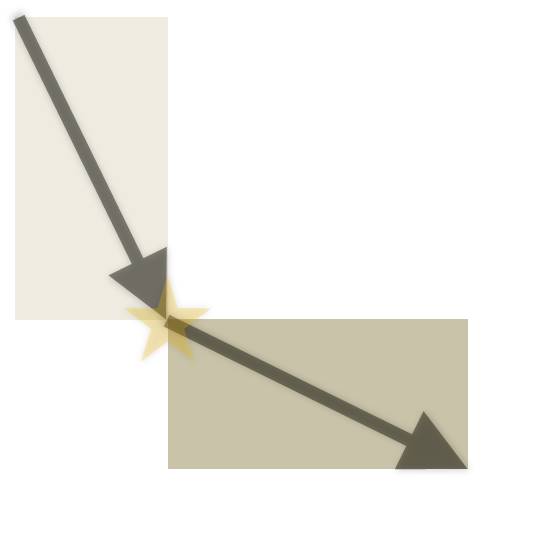
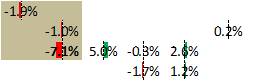
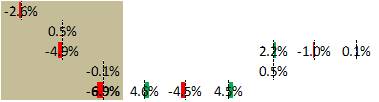
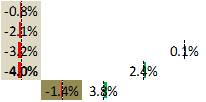
Again this is not meant to show (by the visual scale) the actual distances traveled in percentage points. But it gives us a non-parametric feel for the direction (and the colored bars green and red show the magnitude) of the daily price movements. Even including the horizontal shifting of the price changes, one can see whether there is extraordinary acceleration or deceleration in price changes.
Now in the table below we encapsulate the statistics for the daily prices changes and time duration before (first shaded box in the graph), as well as after (everything after the first shaded box in the graph) the time of ultimate panic. We also state which of the 3 market crash styles noted previously apply.
1950: crash of -4% over 4 days; then -3% over following 5 days. Pattern A
1955: crash of -6% over 2 days; then +1% over following 7 days. Pattern B
1962: crash of -14% over 5 days; then +5% over following 7 days. Pattern C
1987: crash of -35% over 8 days; then +9% over following 20 days. Pattern C
1989: crash of -7% over 2 days; then +2% over following 2 days. Pattern C
1997: crash of -10% over 3 days; then +7% over following 6 days. Pattern C
1998: crash of -13% over 4 days; then +3% over following 2 days. Pattern C
2000: crash of -10% over 3 days; then +6% over following 4 days. Pattern C
2008: crash of -27% over 15 days; then -2% over following 46 days. Pattern B
2011: crash of -14% over 5 days; then +6% over following 7 days. Pattern C
2015: crash of -10% over 4 days; then +5% over following 4 days. Pattern B
Notice that the 10 initial crashes account for a total of 157 trading days (~1% of the days!) We also witness the frequency of these crashes as roughly once every 6-7 years (about the duration of an economic cycle). Also note that you can not simply take the ratios of the price changes over time, in order to measure “speed” of changes, since the second box (when applicable) and the balance of the price graph have been combined into one.
What’s more important for our probability investigation here is that we can visually see that of the 10 initial crashes, only one most fits pattern A. While 2 fit pattern B, and 7 fit pattern C. We then created a probability matrix to show the categorical placement of the data above. For example for the 10 years, up through the day of ultimate fear, we see the following:
less severe more severe
daily price increase 15% 0%
daily price decrease 51% 33%
And following this day of paramount scare:
less severe more severe
daily price increase 46% 8%
daily price decrease 34% 11%
Now repeating this exercise for the recent August 2015 crash alone, here are the statistics, through the day of ultimate fear:
less severe more severe
daily price increase 0% 0%
daily price decrease 25% 75%
And following this day of paramount scare:
less severe more severe
daily price increase 75% 0%
daily price decrease 25% 0%
Additionally the χ2-test strongly evidences that the probability matrix results thusfar (>95% probability) are quite different from the 7 crashes that make up pattern C (either before peak fear, after peak fear, or combined). Noting again that this is the pattern that few people above would a priori feel represents how crashes “normally” occur. Yet it account for roughly 2/3of the crashes we’ve discussed here. Meaning no one type of hedge can cheaply and universally protect from all crashessince they vary in styles.
Given the large portion of crashes -particularly in the past decade- which do not fit the typical mold for how risk models would anticipate market crashes to occur, relying on them at all times is imprudent. Understand that market risk models can change in this period, subsequent top maximum jitters. Eventually when it wreaks havoc, it is sometimes too late to appropriately hedge or know how to speculate in order to stay long with leverage in the hopes for spike in rebound days. We may see this all unfold again, at a later point, but instead with bonds. Then we’ll again overly exposed funds and investors, in a hysteria once more.

Running fancy probabilistic pattern seeking research is a first step and just one facet towards gaining experience in portfolio management. The next 10,000 hours of gaining hands on trading / investment expertise ( then mastery ) is the “hump”. Many think that there is an easy transference of competencies ( med school, physics, mathematics, etc. ) into understanding market science, yet they can’t replace the years of hands on experience in the use and experimentation of leverage, the behavioral aspects in dealing trading losses / gains, boredom / dry spells, frustration, model development / refinement, data acquisition / rejection, etc.
My interpretation of this piece:
1. Markets usually have a dead cat bounce after a short period with intense selling, but not always.
2. Markets are sometimes higher and sometimes lower than the crash bottom a few or months after a market crash.
3. It doesn’t appear to be possible to definitively identify which of these alternative outcomes will occur before they occur.
“The key for investors (if they must be active)”
But if they can be passive then virtually none of all the rest that follows matters.
my scroll wheel overheated on this one…