Small-Business Rescue Shows Not All States Are Created Equal
Source: Data by Evercore ISI via Bloomberg
This is shocking but not surprising:
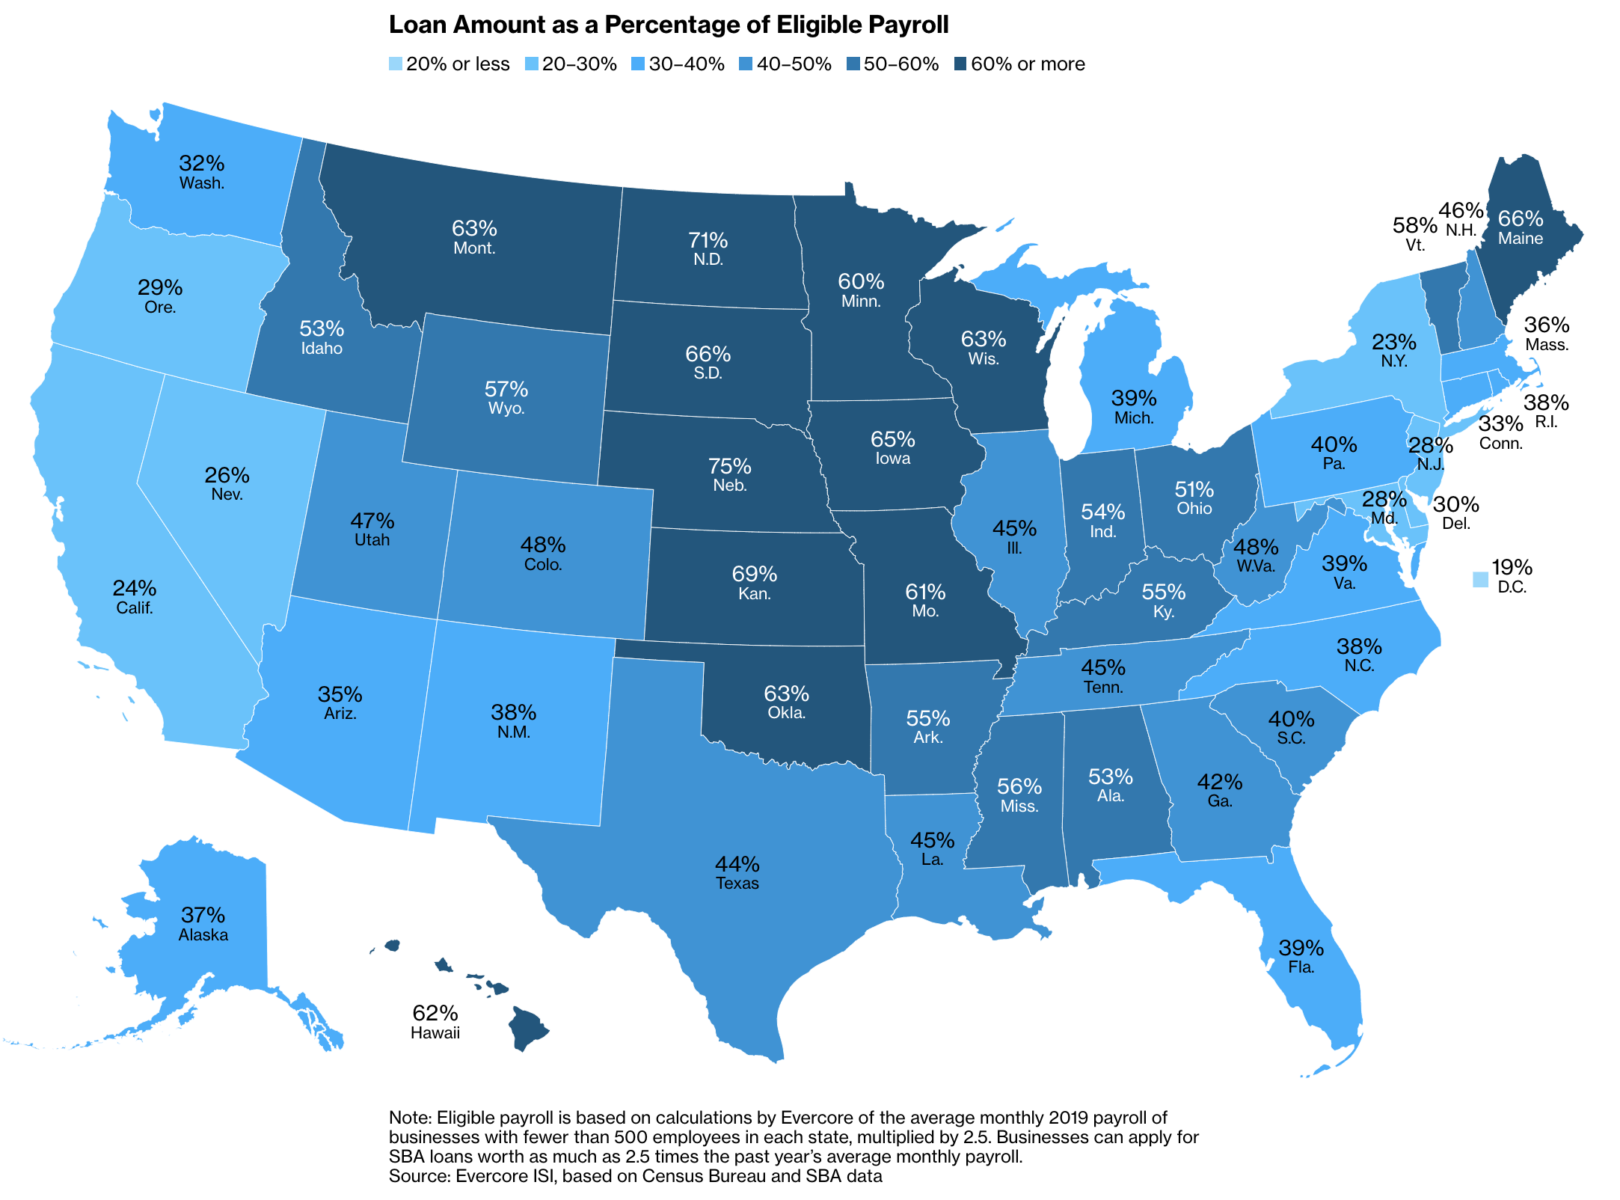
During the first 13 days of the federal government’s small-business rescue program, the spigot was wide open in Nebraska. Firms there got enough money to cover 82% of the state’s eligible payrolls. It was a different picture in New York and California, where companies did only half as well.
Maybe it is just a coincidence; perhaps it is a function of how the PPP was set up. Regardless, it seems like some states did better — and in some cases, so much better — than others.
Regardless, PPP2 is coming, with another $300 billion or so in the till. I am curious to see how the dollars get distributed, and whether there is any political mischief around it.
I really don’t want to believe that any foul play or corruption afoot, but it would be very on brand for this administration.
UPDATE: April 20, 8:06am
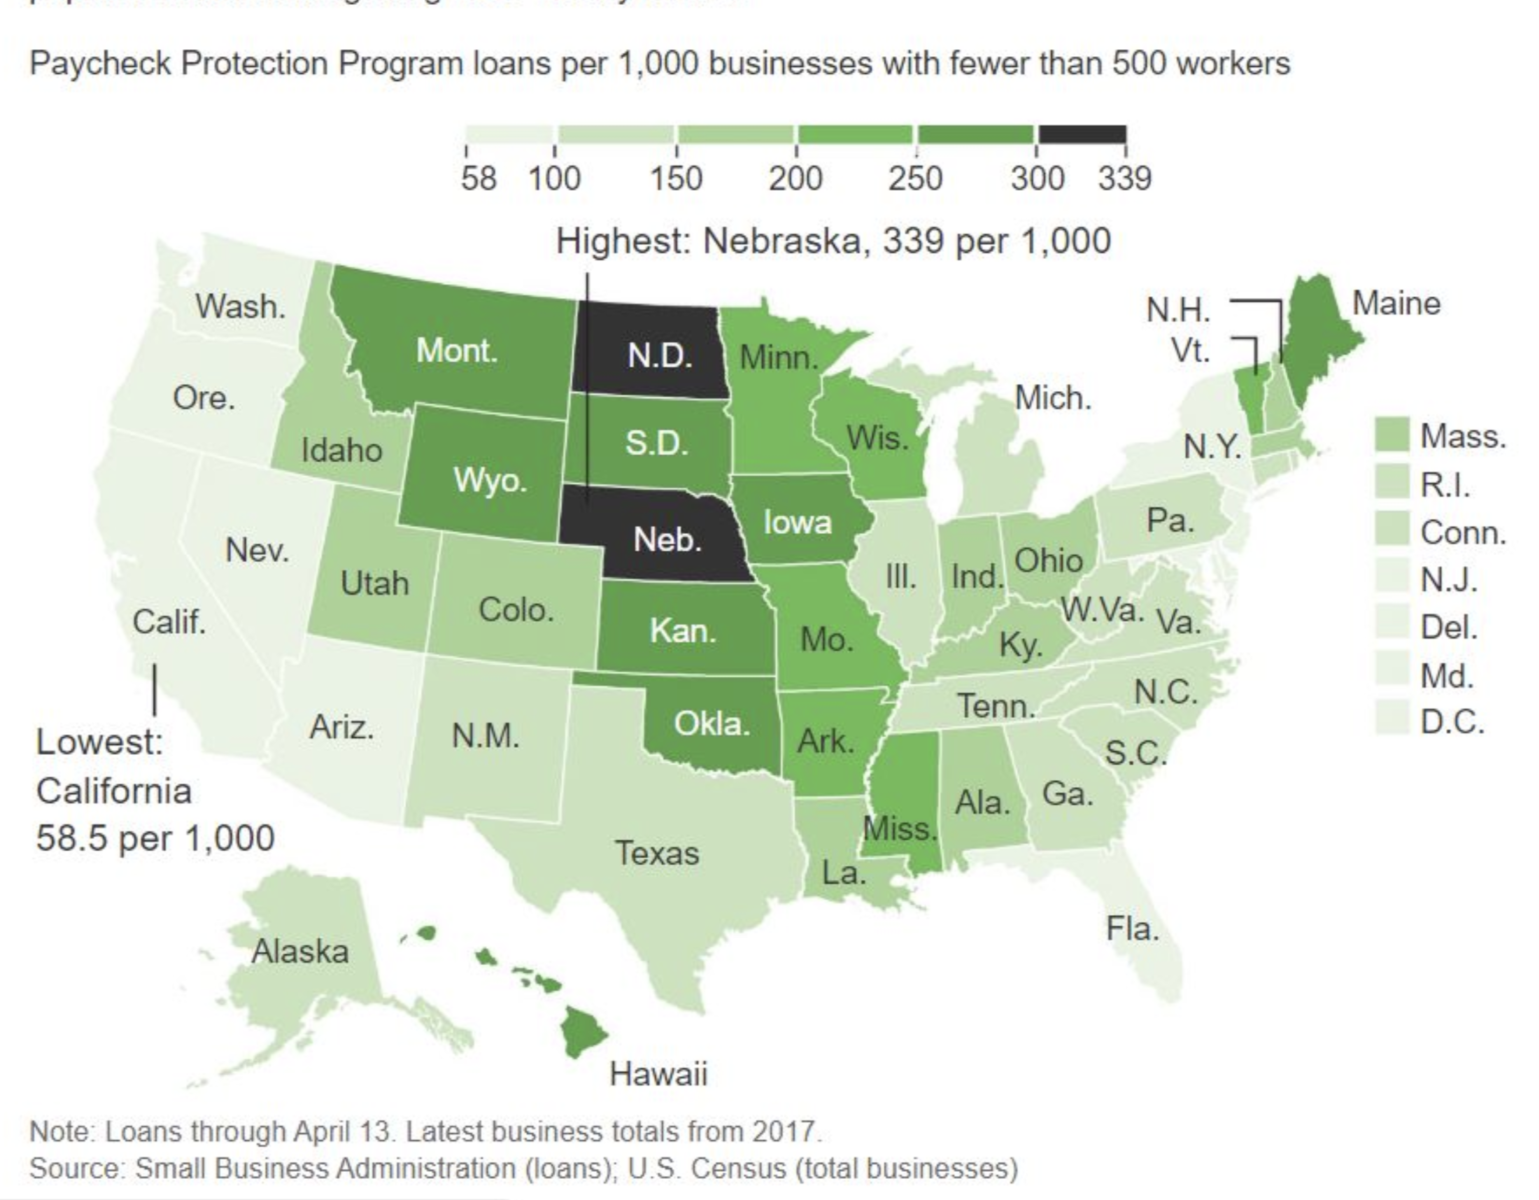
I like this map via Tim Hanso showing correlation between loans per businesses with less than 500 workers. Perhaps there is a relationship between Community bank density and PPP loan originations as well.