
To hear an audio spoken word version of this post, click here.
In 2019, Ritholtz Wealth Management was one of five beta testers of O’Shaughnessy Asset Management new direct indexing software, Canvas. As Chair of RWM’s Investment Committee, I wanted to share my experiences – about direct indexing generally, Canvas specifically, and what future opportunities this form of asset management might have for both investors and wealth managers. This is the part one of three; part two will focus on diversification, part three on ESG.
This is the week in April when everyone is scrambling to finish their taxes. That pandemic postponed deadline is a good opportunity to discuss a related aspect of your annual filing: Capital Gains Tax. I want to delve into the advantages Direct Indexing (DI) versus traditional mutual fund and ETF portfolios, in particular, the enormous benefits of DI in Tax Loss Harvesting (TLH).
Direct indexing has been on my radar for nearly a decade. My buddy Dave Nadig (ETF database) has been the biggest, most knowledgeable bull I know on DI. We have discussed and debated this topic over the years, with me slowly becoming more open minded about its potential but skeptical it could ever replace passive indexing. Portfolios with 2,000-3,000 individual stock holdings have their own set of complications1 versus cheap,2 simple, passive ETFs.
But I was intrigued by the potential of the idea. Direct Indexing allowed RWM to:
-Get very granular in terms of negative screens for socially responsible and/or Environmental, Social and Corporate Governance (ESG) investing.
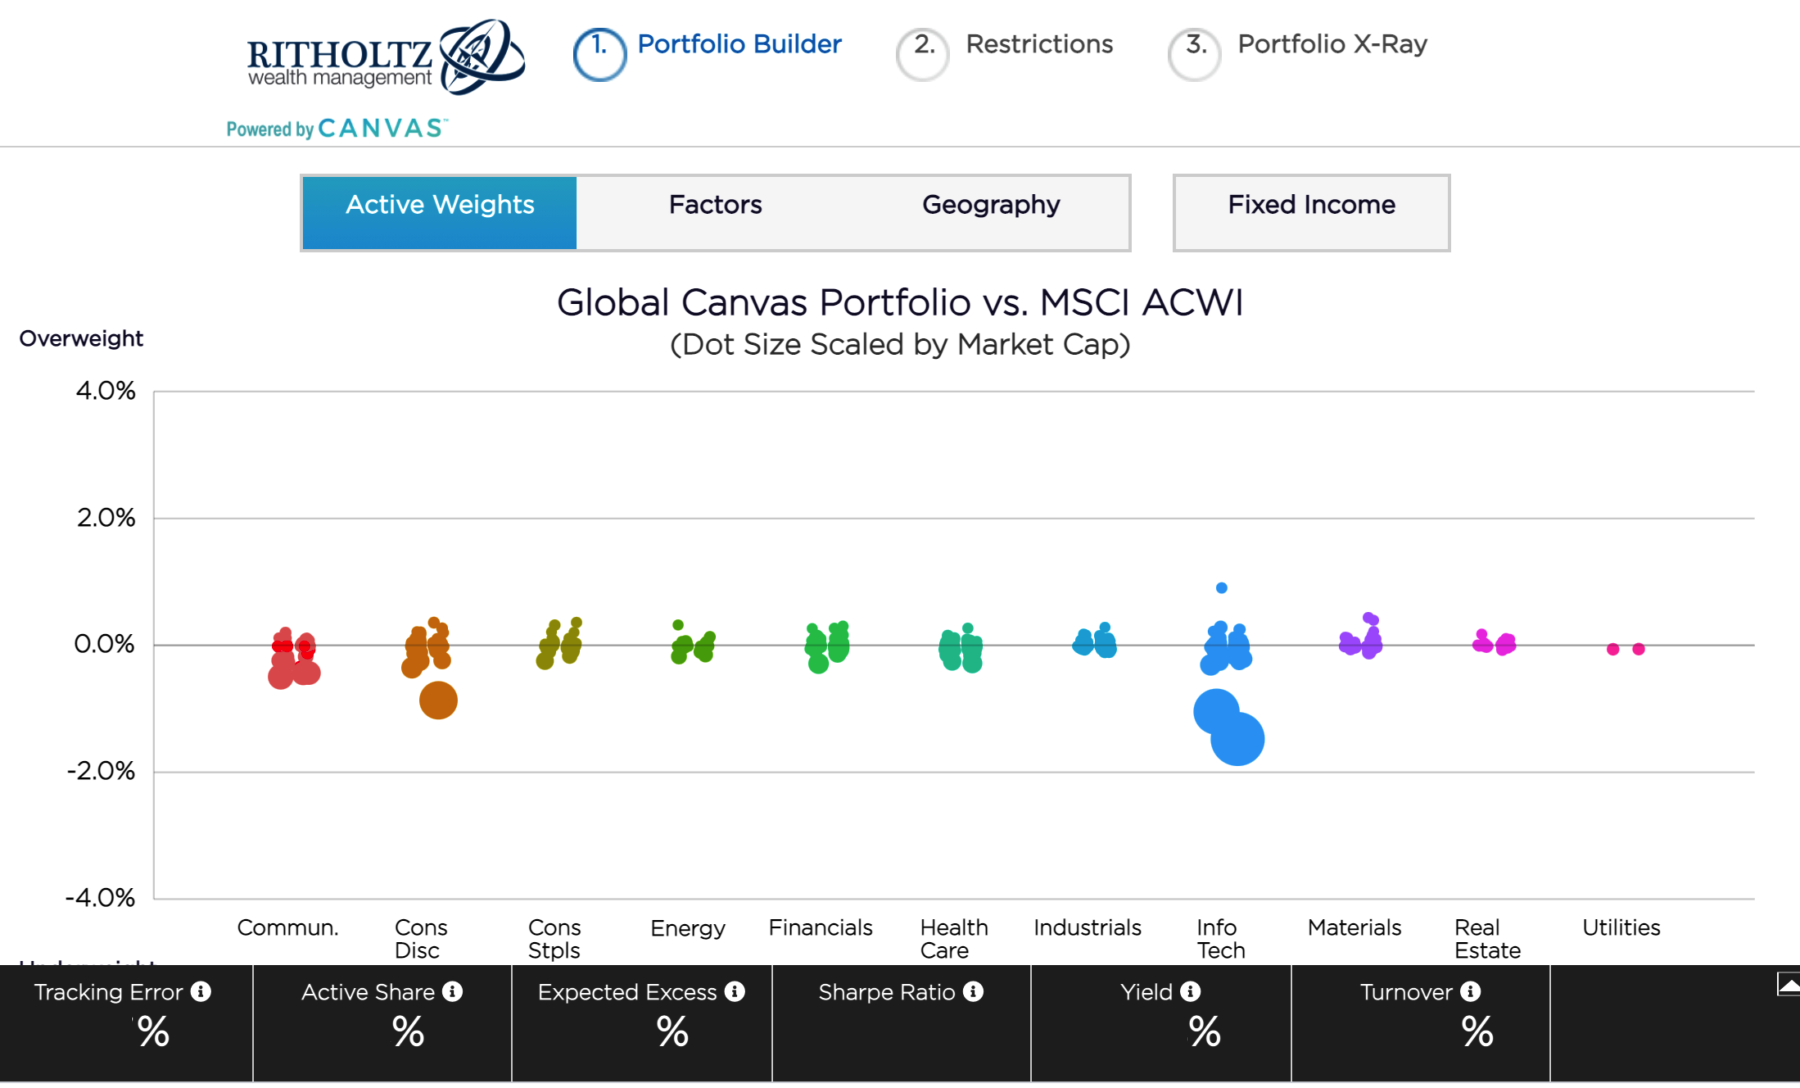
-Use positive screens to tilt a portfolio towards certain factors (value, quality, size, etc.).
-Shift a portfolio away from a given sector/style, when clients’ income and equity were already over-exposed to that space via their employment (Salary, ESOP, options, etc.).3
-Tax loss harvest portfolios consisting of individual companies versus those with broad ETF and Mutual fund holdings.
My initial assumption about how clients (or prospective clients) might warm to direct indexing was in that order: ESG, factor tilts, risk diversification, and last, tax loss harvesting. What 2020 revealed was I had it precisely backwards: The biggest driver of direct indexing for RWM clients was reducing capital gains taxes from concentrated equity holdings. These are employee-owned stocks or other concentrated equity positions, often having a very low-cost basis.
Typical tax loss harvesting: Consider a portfolio holding a dozen mutual funds. Advisors who TLH sell the portfolio positions that are down to capture the loss; those are replaced with a near identical alternative. The realized gains in the portfolio are offset (somewhat) by the losses. Done right, it can reduce a clients’ capital gains tax costs by 20-30 bps of the portfolio’s value. Some years more, some years less. 40-50 bps is considered a very good year in tax loss harvesting.
Direct Indexing is vastly superior to mutual fund TLH for several reasons:
– The potential pool of tax loss choices number in the hundreds or thousands, not 10-15 funds.
– Market volatility creates numerous opportunities.
– Granularity allows a very targeted approach.4
– Direct Indexing allows investors to “access losses” that fund owners cannot.
That last point is the most significant aspect of DI loss harvesting.
Consider these details about equities in general, and mutual funds in particular: It is well established that most portfolio gains come from a relatively small handful of outsized winners. Depending on your preferred academic study, it can be as much as 4% or as little as 1.3%. In a portfolio of 100 stocks, somewhere between 1 and 4 of those stocks will account for all of your gains. Hence, 96-99% of equities simply average out to flat, i.e., winners offset by losers.
Herein lies the huge advantage of direct indexing over ETFs and Mutual Funds: Accessing losers that would otherwise net out to zero.
The performance of any fund or index is the sum total of its individual holdings’ gains and losses. A quarter or yearly performance is simply the average of all of the capital invested in the winning positions minus all of the capital in the losing positions (relative to their cost basis). For mutual fund holders who tax loss harvest, they are working with this net average.
Mutual fund investors who wish to TLH have to treat the mutual fund for what it is – a single security, whose cost basis changes over time based on distributions. They don’t get to look inside the portfolio and say “sell XOM!” to book the loss. They only get to treat the fund as a, well, fund.
Said differently, the fund itself – the vehicle holding all of those winners and losers – only lets investors access that average net gain or loss. This is why the vast majority of losses are inaccessible to the fund holder. The winners that drive upside performance work against those losers when it comes to tax loss harvesting.
Direct Indexing grants access to ALL OF THE LOSERS, without requiring the owner to do anything with the winners. This is a massive advantage to anyone selling a concentrated position, because more of the capitals gains tax obligation that sales creates can be offset.
In 2020, accessing losses turned out to be the single biggest driver of direct indexing for RWM clients who had either low-cost basis stock or concentrated equity positions to sell.
How much so? Last month, the team at OSAM and I performed an intensive review of RWM clients who were using Canvas.5 RWM manages about $2 billion in client assets, of which more than $300 million is invested in direct indexing via Canvas. These include about 160 taxable accounts, and our average after tax excess was about 80 bps since inception through end of February 2021.
UPDATE: As of Q3 2024, we have over $1.5 billion of our total $5.1 billion in AUM on Canvas.
If that sounds like a big number, it is – but recognize how it was skewed by unique pandemic related events, namely, the 2020 February-March collapse of 34%. Timely harvesting of losses after that crash was an important factor.
Breaking those down further, of 160 accounts, about half were opened after that period — where markets have gone (more or less) straight up. They have yet to really capture many losses.
The data are further skewed by the taxable accounts opened before the crash. These accounts have seen tax harvesting in excess of 4.75% (versus pre-tax). That is an utterly wild number, and an obvious outlier: It’s a handful of households (small sample set) that benefited from the 2020 crash/recovery (outlier event) for accessing those post-crash losses to tax harvest in February and March 2020. Those who direct index should not expect to capture 475 basis points of losses under normal circumstances.
Given how unusual Q1 2020 was, and how small this sample size is, I would guess offsets of that sort come along quite rarely — perhaps once every decade or two? But what it does is show the proof of concept as to what direct indexing can accomplish when all of the stars line up just right versus traditional mutual fund TLH. Under normal circumstances, I expect a significant improvement over traditional tax loss harvesting of ETFs + mutual funds. I want to emphasize that no one should ever count on 475 basis points.
It was a surprise that these concentrated positions are what has been driving so much of the activity in our direct indexing portfolios. But with the benefit of hindsight, it should not have been. The tax losses are real, not a theoretical benefit. They are hard dollars, quantifiable and specific. Clients see actual dollar savings annually via their personal tax returns. The advantages of direct indexing for ESG and diversification are certainly strong, they are just harder to quantify in a way that is as visible as an investor’s annual tax filing.
Direct indexing is now 15% of RWM’s assets. I expect it to grow to nearly half of client assets over the next 5 years. Managing the capital gains of concentrated positions are likely to be one of the biggest drivers of that growth.
In a future post: Diversifying risk away from your job and employer income.
If you want to learn more about managing concentrated equity positions or need help with any aspect of your portfolio, please contact us here.
UPDATE: Tax Alpha April 14, 2022
___________
1. Administrative concerns include: Enormous monthly brokerage account statements, endless pages of annual reports, notifications for each and every corporate action or announcement, and many other minor annoyances.
2. Once trading costs dropped to zero, a large cost impediment to direct indexing disappeared.
3. Diversifying out of concentrated positions seems to be driven by two dominant factors: When you want/need the capital, and the volatility of underlying stock. Let’s say you have a concentrated position in Google or Home Depot, you can sell 10-15% of that concentrated position per year for 7-10 years, and depending on what markets do, end up with a modest cap gains tax bill. If you hold more volatile stock (Zoom, Uber, or Netflix), or want access to the cash sooner, you might spread out those sales over 2 to 5 years.
4. When substituting one individual stock for another, the replacement needs to be similar in terms of numerous elements such as value, market cap, volatility, sector, liquidity, growth, revenue, earnings, trading characteristics, etc. Canvas allows that sort granularity when selling one stock and replacing it with another. The two may not be identical but they can be very close. The more individual names that are swapped, the greater potential “drift” from the original portfolio characteristics. This is what I am referring when referencing a “targeted approach.”
5. Special thanks to Ari Rosenbaum, who helped me analyze the specific data around the tax issues for RWM clients; and to Patrick O’Shaugnessy, who has been the driving force of Canvas, and has continually helped to incorporate new features and services for Canvas.
