
To hear an audio spoken word version of this post, click here.
Back in March, on the one-year anniversary of the Covid market lows, we discussed why those “off-the-lows” charts might be misleading. The TL:DR: 12-month S&P 500 performance from March 23, 2020, to 2021 was 74.8%, but the 13-month performance from February 23, 2020, was a mere 15.5%.
Context matters.
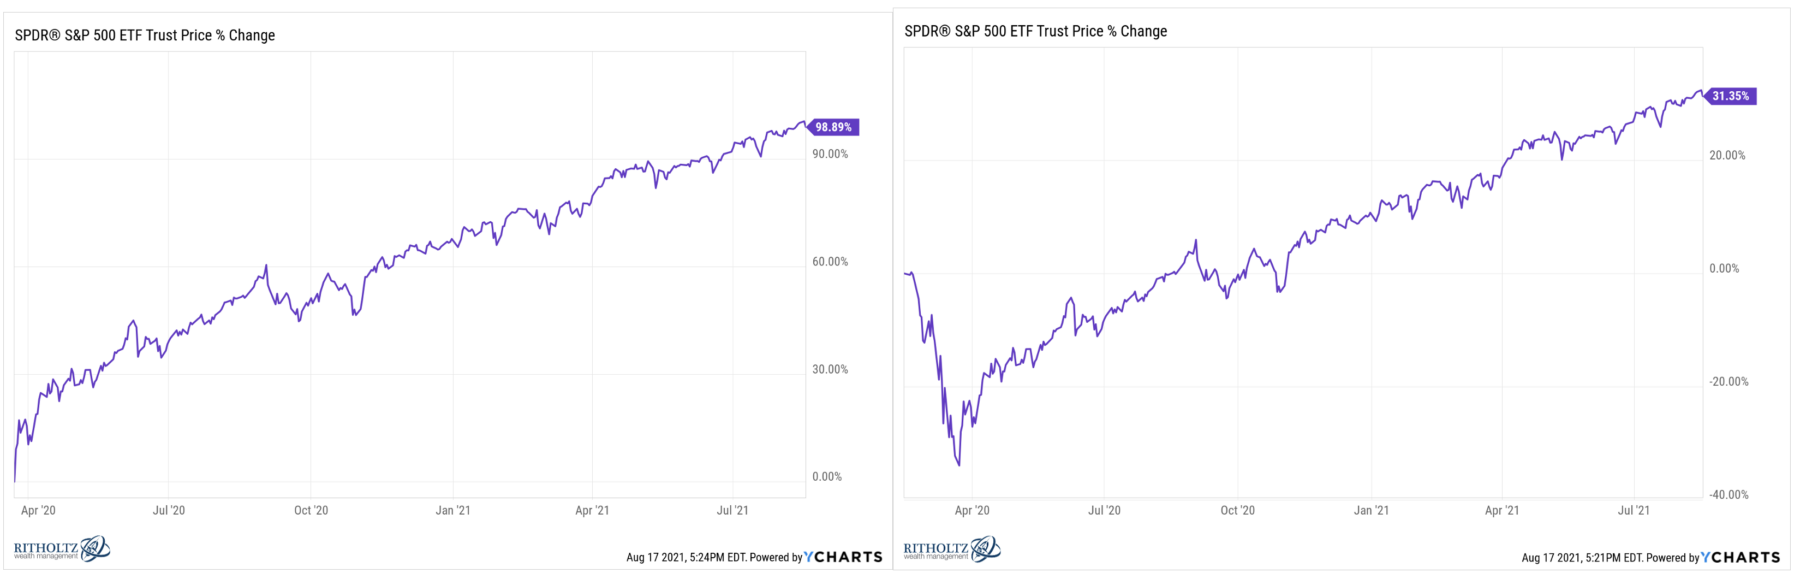
As of this week, the returns on the broad SPX index are up about 100% off of those same lows. This doubling is catnip to many, the kind of clickbait that cannot be ignored. Hence, we see context-free headlines like “S&P 500 doubles from its pandemic bottom, marking the fastest bull market rally since WWII,” and while that headline is technically accurate, it is more misleading than useful to investors.
Why? As we have noted so many times before, when markets get hit with a non-economic, non-market-based externality, they respond by wobbling for a bit and then resuming their prior trends. Examples include Pearl Harbor, JFK assassination, 9/11, and Covid. I can even make a case to include 1987 (but it’s a stretch).
When the Coronavirus was recognized as a threat in February 2020, the market rolled over 34% as pernicious fear dominated and the economy ground to a halt. That collapse was met with a massive Federal rescue plan, 2 trillion dollars plus zero percent Fed fund rates, and a huge push for vaccines. The market soon bottomed and reversed itself. This was an effective response to an externality. This is not the result of hindsight bias — we discussed this in real-time at the market’s lows.
Hence, while 100% gains make for great headlines — see this, this, this, or this — those context-free stories are of little use, and may actually be actively misleading to investors.
For proper context, I would suggest three factors explain the markets’ 30% move higher:
1. Dated pre-pandemic, pre-February 2020 crash, the S&P500 is up 31.25% — more than two-thirds less than that (so-called) doubling.
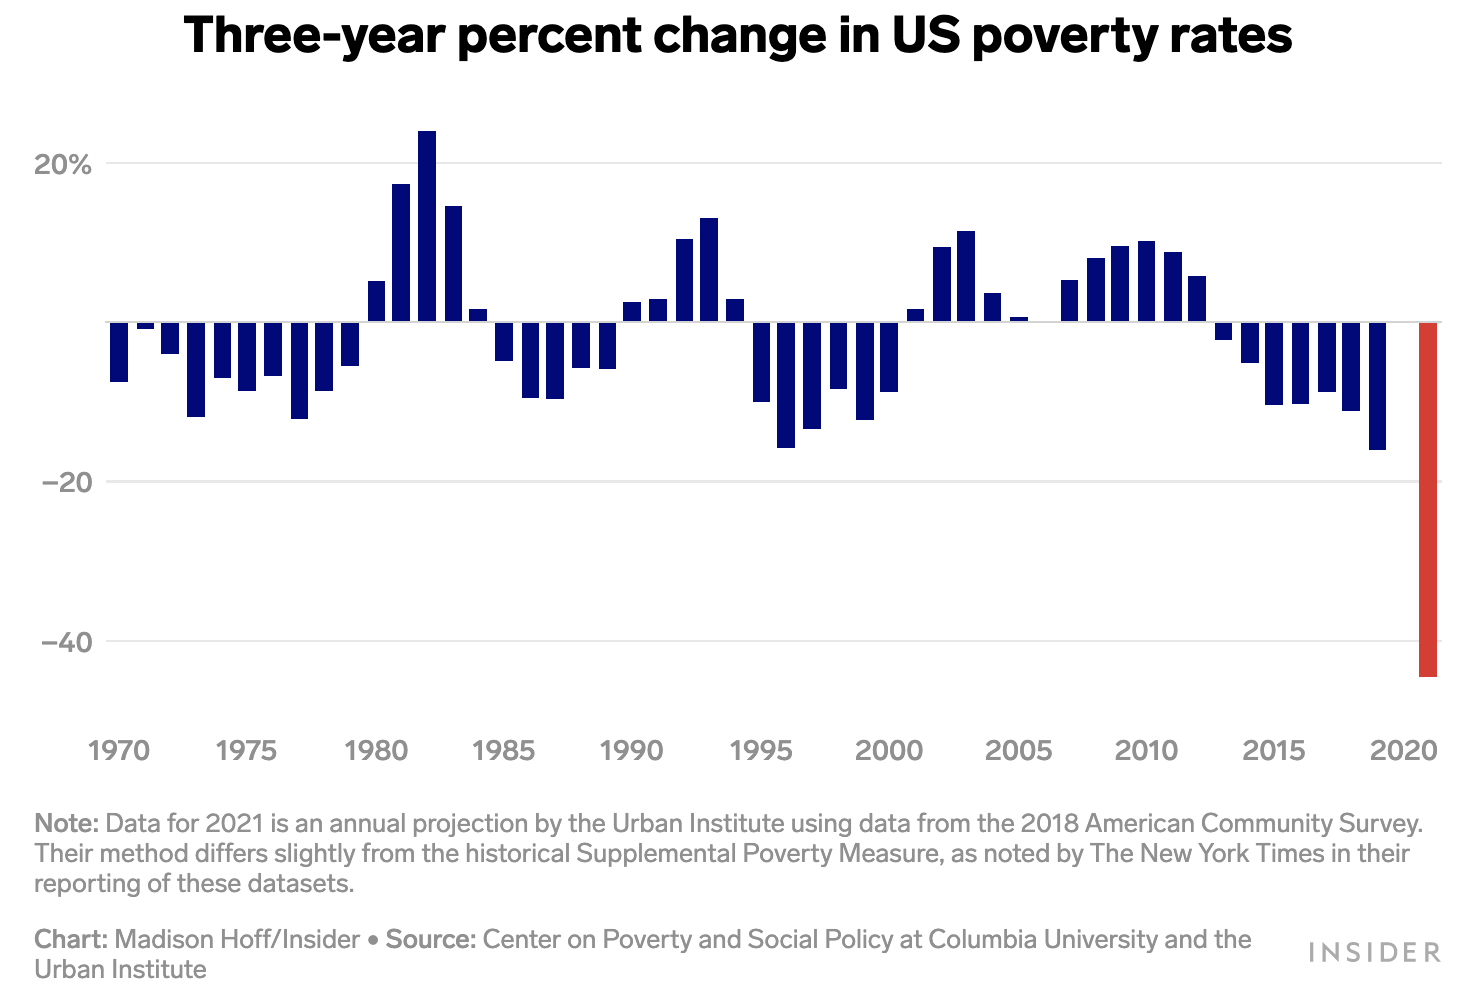
2. About 4 trillion dollars in stimulus has been passed and (mostly) spent. CARES Act 1 2 & 3 all put so much cash into the US economy that it — literally — lowered poverty levels nearly in half.
3. The Fed took rates to Zero, and kept buying bonds (QE), helping to drive rates so low that despite rising home prices, home affordability has remained surprisingly okay.
These three factors, and a myriad of others, help to explain market prices up a third from pre-pandemic levels.
Previously:
Bull Market Bull (March 31, 2021)
End of the Secular Bull? Not So Fast (April 3, 2020)
Don’t Panic! with apologies to Douglas Adams (March 9, 2020)
How Externalities Affect Systems (August 14, 2020)
Don’t Suffer From Denominator Blindness (October 14, 2015)
click for audio
