
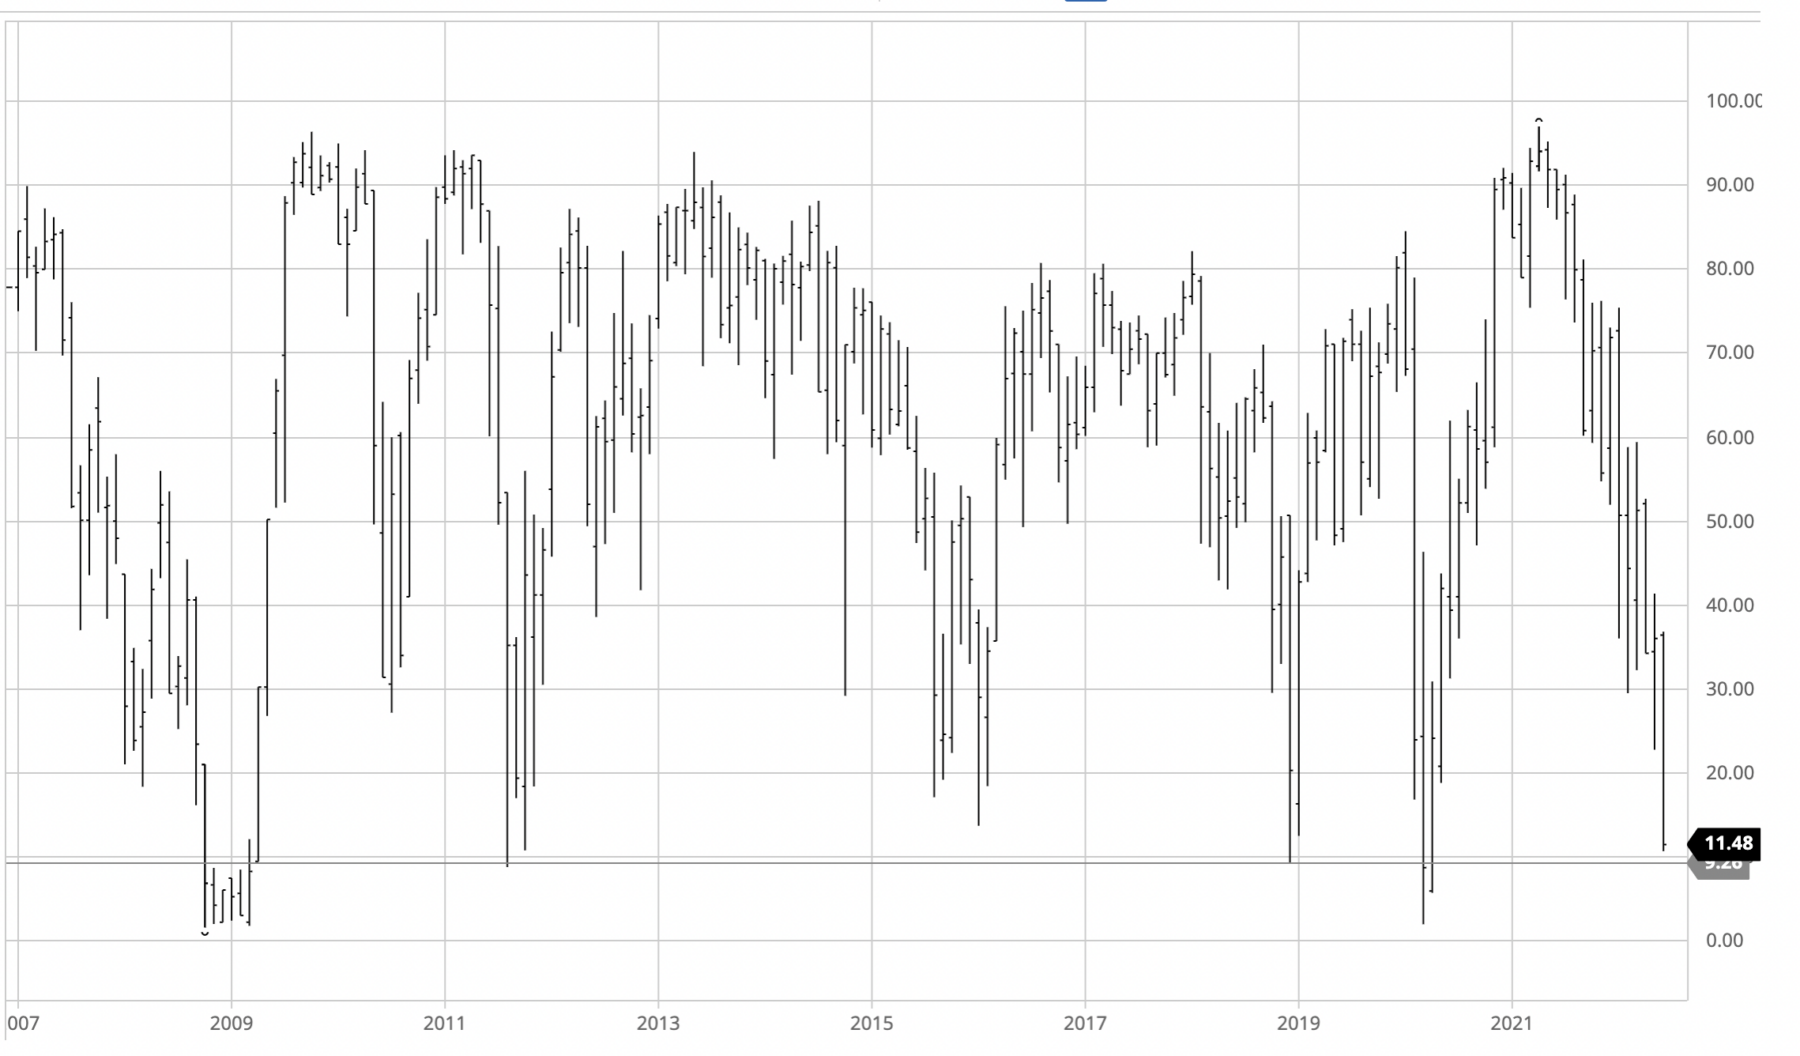
Percentage of S&P 500 Stocks Above Their 200-Day Moving Average
We now enter the most challenging part of the bear market: The tedious middle.
This is the portion of the bear cycle where we’ve fallen far and long enough to have scared off the BTFD crowd. There is an excess of bears. More importantly, a variety of technical indicators are near as oversold as they ever get. It is encouraging to those who are hoping the worst of it is behind us.
So we rally.
I suspect this may not be anything more than a relief rally, a way to work off a deeply oversold condition. We discussed this concept generally ~two months ago in “Too Many Bears.”
It’s a bottom, but is it THE bottom? I dunno…
Consider a few indicators that most of the time, are not especially informative, but at extremes, can be very useful:
• Away from 200 day Moving Average: S&P 500 was 16.9% below its 200-dma, a fairly dramatic move below its trend line.
• Percentage of stocks above 200 day moving average: Only 11.3% of the S&P 500 stocks are trading over their 200-dma last week. This is a fairly deeply oversold level.
• Volatility: The VIX rose to 31.1 last week – elevated, but not the sort of capitulatory levels we have seen prior.
• Put/Call Ratio: Rose above 0.80 – higher than average, but not at historical extremes (e.g., 2020, 2018, 2010. 2008-09, 2000-02 etc.).
• Consumer Sentiment: At 59.4%, it is below the 1990 (65.5%) and 2001 (82.7%) lows but above the 2008 (55.3%) and 2011 (55.8%) levels.
Markets are deeply oversold, but not necessarily at the sorts of levels that have been permanent lasting levels. That lowers the probability that this rally is sustainable, and raises the chance it’s merely a bear market relief rally.
Over the weekend, I must have seen a dozen historical analogies, all of which seem to know where and when to buy: Prior market action during inflationary cycles, what the 2nd year of the presidential cycle (or midterm markets) do, average pullback during Fed rate hiking cycles, median drawdowns during recessions, average length/depth of corrections, etc. I am sure there are many others.
Be wary. This present cycle is so unusual – pandemic lockdown, fiscal stimulus, overdue wage increases, inflation spike, supply chain issues, ongoing global pandemic, and a Fed overreaction (even panic) – that prior cycles do not fit very neatly. Be cautious of any analyst or forecast that has way too much confidence in its favorite historical analogue.
One last thought: The key to whether this is “The Bottom” or “a bottom” is how markets trade during an oversold rally: Do we get a one-day wonder? An intraday reversal where the strong futures can’t be sustained? Can the market put together a string of days and weeks where the sellers are exhausted and the buyers drive prices higher on expanding volume? Or, have we merely become so oversold has the rubber band been pulled so far to one direction that we get a snapback that fails to hold?
We will know soon enough. My suspicion is we haven’t done quite enough work on the downside to have a true bottom — that’s just a gut feel, also take it as my educated guess.
Previously:
Too Many Bears (May 3, 2022)
Too Late to Sell, Too Early to Buy (June 16, 2022)
One-Sided Markets (September 29, 2021)
