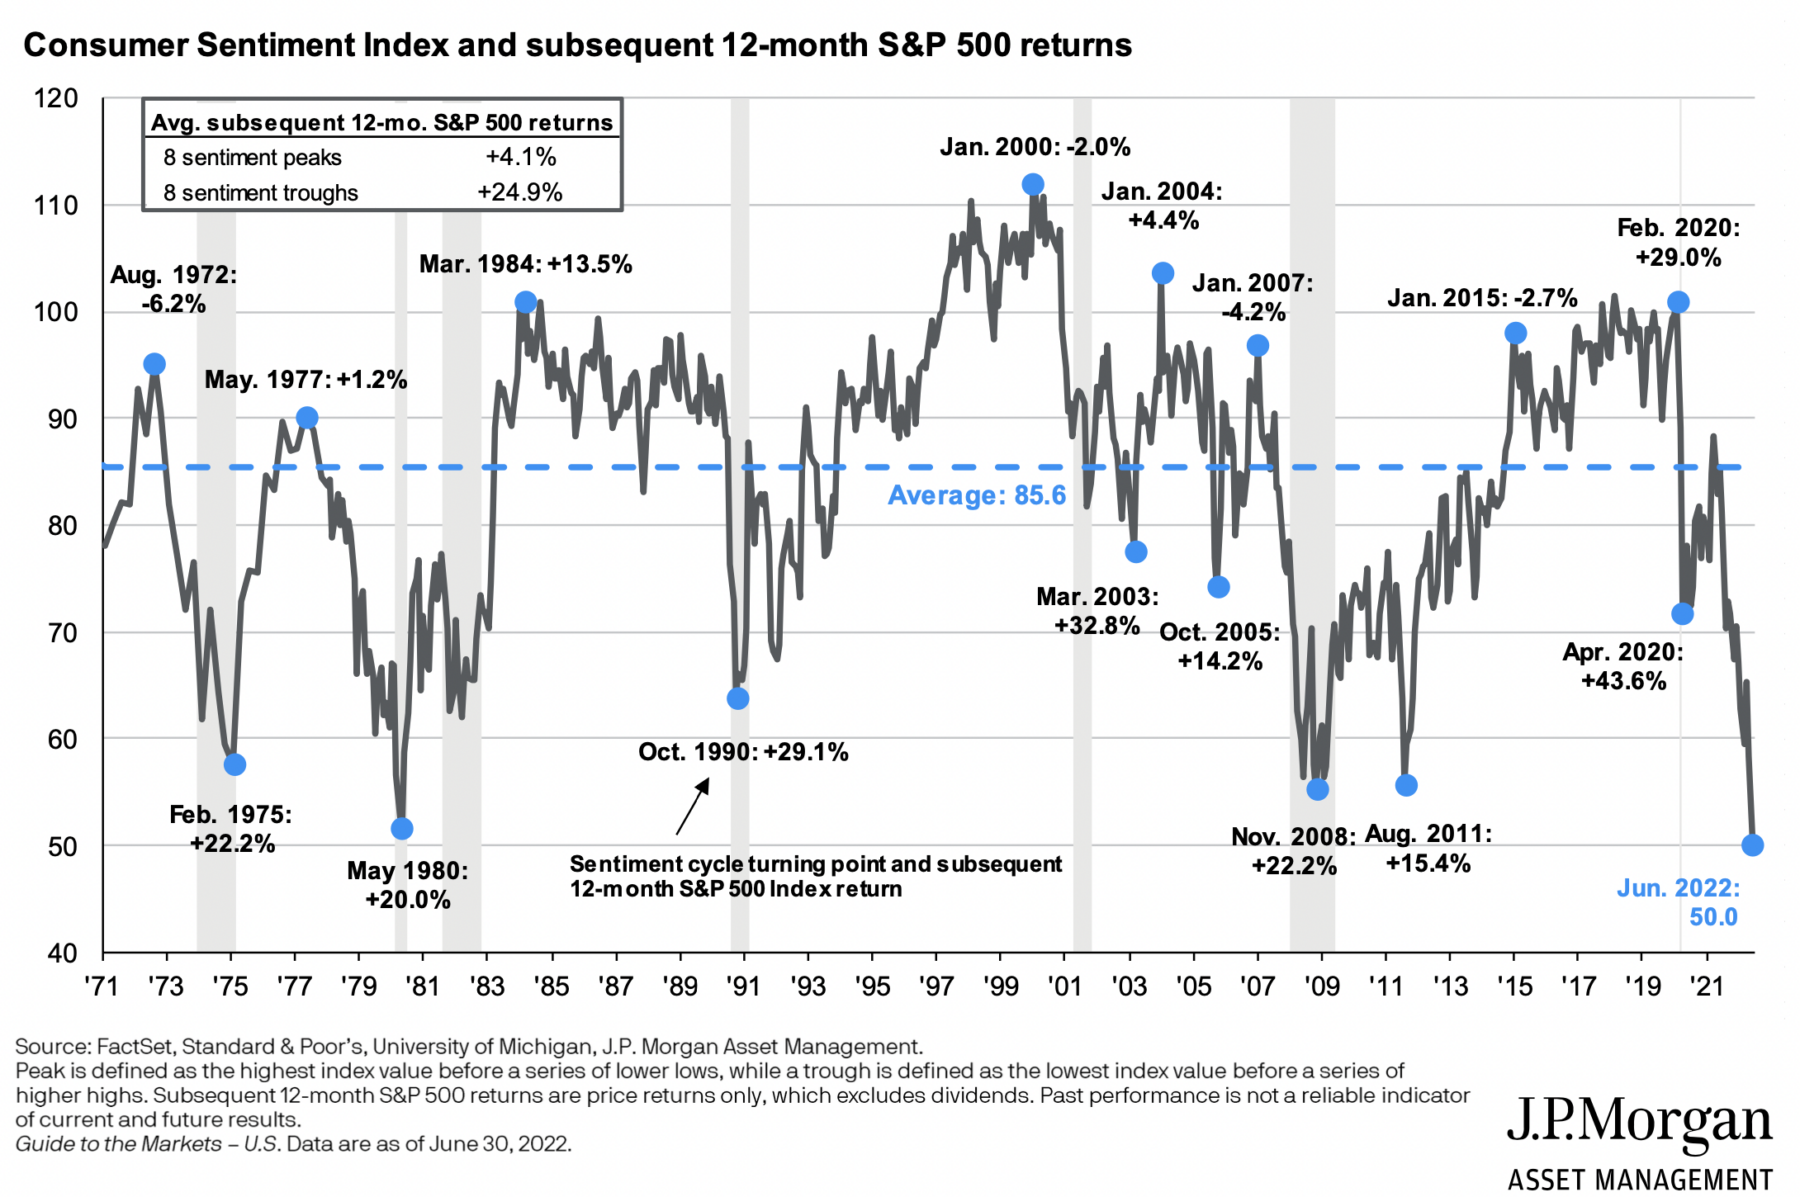
Yesterday’s discussion on Sentiment generated a lot of interest. Some people agreed that echo crashes are a form of trauma-related emotion; others pointed out that sentiment is always backward-looking; still, others noted the advertisements and media focus after a recession or market crash tends to be things that reflect generals fighting the last war.
As the updated Q3 chart from JPM (above) shows, Sentiment readings can be fantastic contrary indicators. The problem, as alluded to in the title of this post, is that it is so rarely actionable. Even then, most of the time it’s a noisy data series, and only actionable at true extremes.
For example, if you want to use the U Mich Consumer Sentiment Index as Buy signal, it has a good track record for the 5 or 6 signals it has generated over the past 50 years. I guess you could buy out-of-the-money 1-year call options when the level drops below 60 (4 signals: 1975, 1980, 2008, and 2011) or 65 (1 signal: 1990).
Note: This generated a buy signal in March, and so far, that has been a loser. Spotting 1-Year Leaps a 16% advantage is not the best way to generate a trading profit. Perhaps the Q2 signal will be a money maker, or the Q3 signal, or at this rate, the Q4 signal (yet to come). It’s been good for a trade 4 out of 5 times, not a perfect track record, but worth watching.
There are those rare people who do this well, but they are few and far between.
Previously:
Why Does Consumer Sentiment Have Echo Crashes? (July 7, 2022)
The Challenging Middle (June 21, 2022)
Too Late to Sell, Too Early to Buy… (June 16, 2022)
Too Many Bears (May 3, 2022)
One-Sided Markets (September 29, 2021)
Source:
JPM Guide to Markets, 3Q 2022, June 30, 2022
See also:
Consumer Confidence and Stock Returns (Journal of Portfolio Management, 2003)


