
“Are we there yet?” is not just a line from the kids in the back of the car — it’s the question that investors, speculators, and professional traders have been asking themselves lately.
TL:dr? Almost.
We are almost there – down ~25% this year (so far). I wouldn’t call this an orderly sell-off, but it also hasn’t been the sort of collapse associated with true crashes like the 2000 tech wreck or the subprime mortgage/derivatives crisis. Still, we’re getting close to the levels that make my inner contrarian sit up and pay attention.
For context, think about the times when all of the stars lined up and a major reversal was fairly obvious. Events such as the tech/dotcom implosion, the double low in Oct 2002 and March 2003, the Great Financial Crisis in late 2007/early 2008, the lows in March 2009, and more recently, the 2020 pandemic. These appeared as real-time, higher-probability trades — but only if you were fortunate enough to be looking in the right place at the right time.
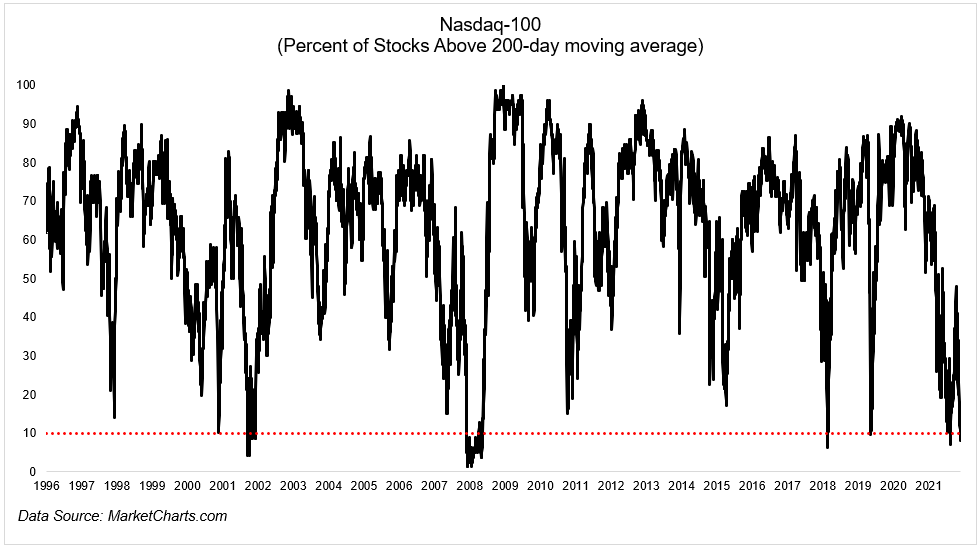
Consider the chart up top via Michael Batnick. As he correctly points out, the Nasdaq has always been higher a year later when more than 90% of the NDX 100 are trading below their 200-day moving average.
What makes this so challenging is that you very often have to go lower before you go higher. If you look where those NDX signals are given, it is before – and sometimes way before – the bottom. Hence, it’s why it’s more of a heads-up and not a true bottom indicator.
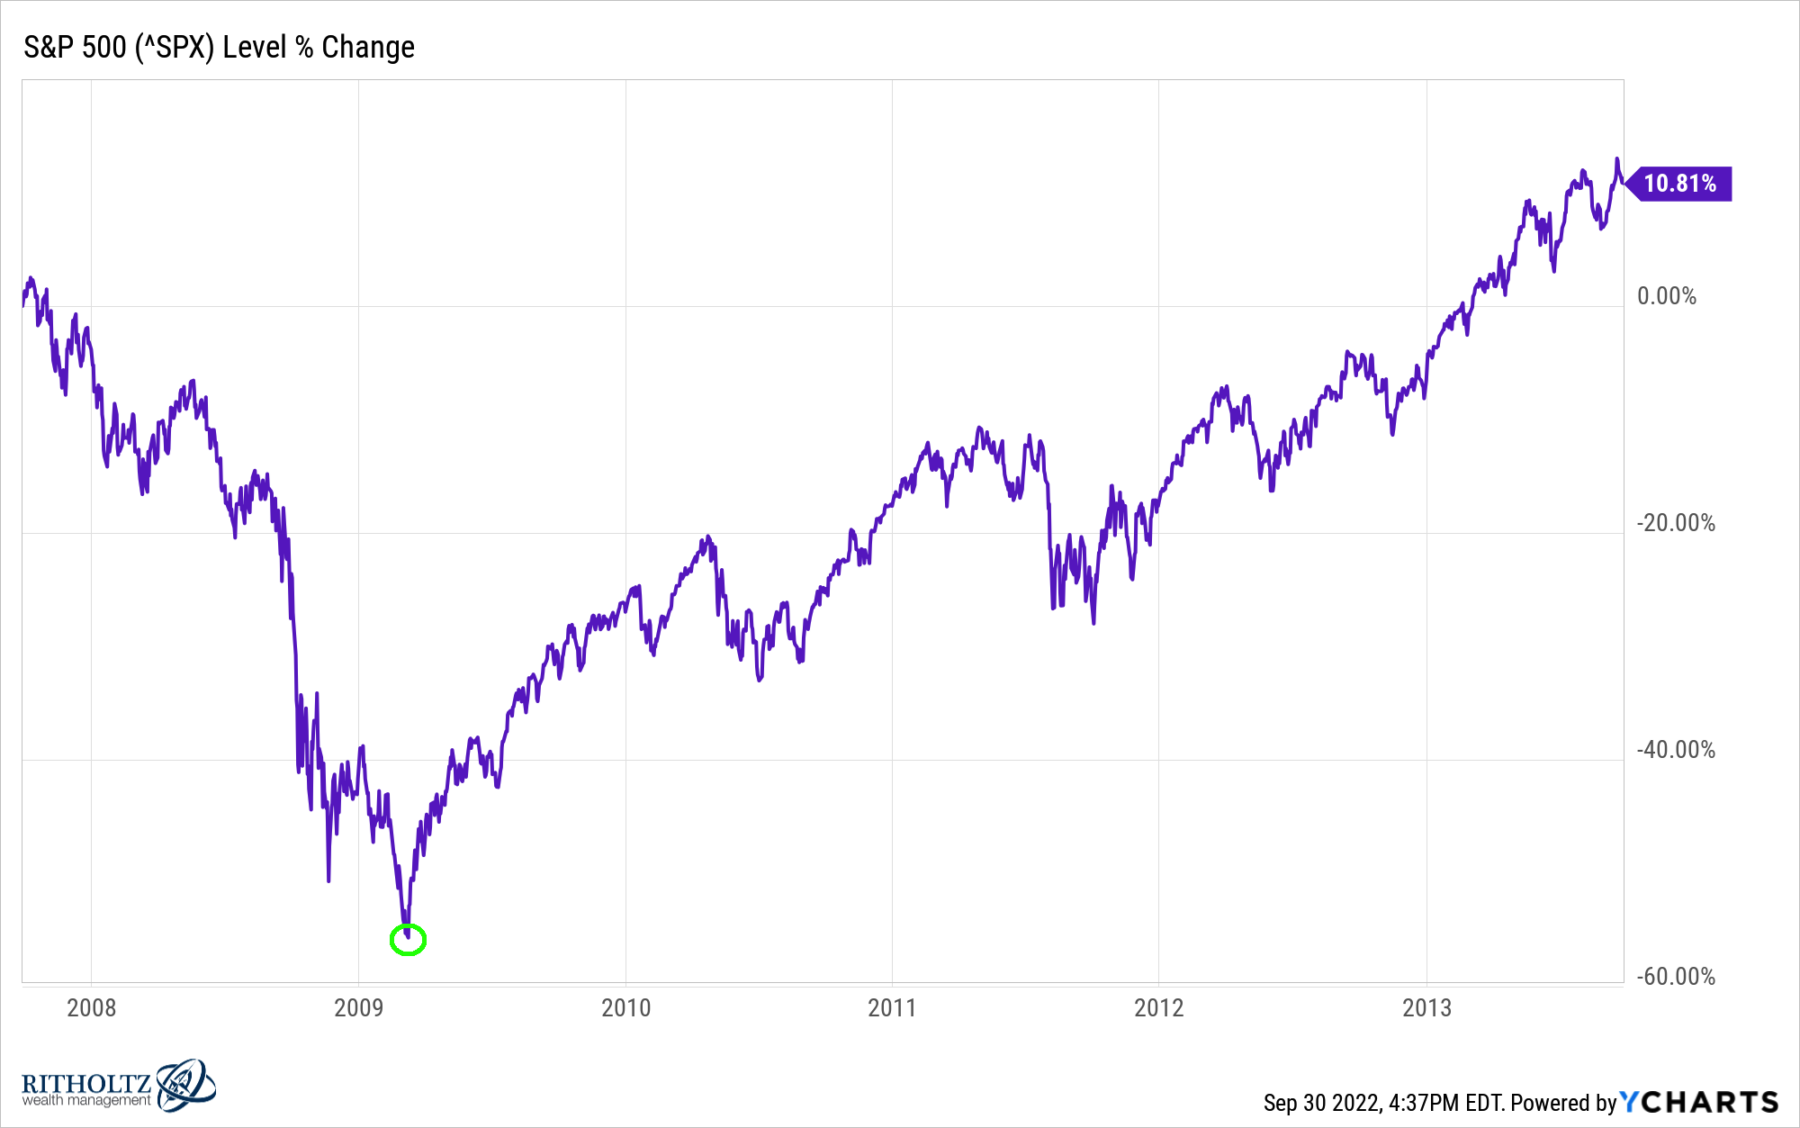
When markets begin to fall apart, I (sometimes) hear from folks looking for attractive entries. Picking tops and bottoms is an art when you do it for fun, but a fool’s errand if you run money professionally.
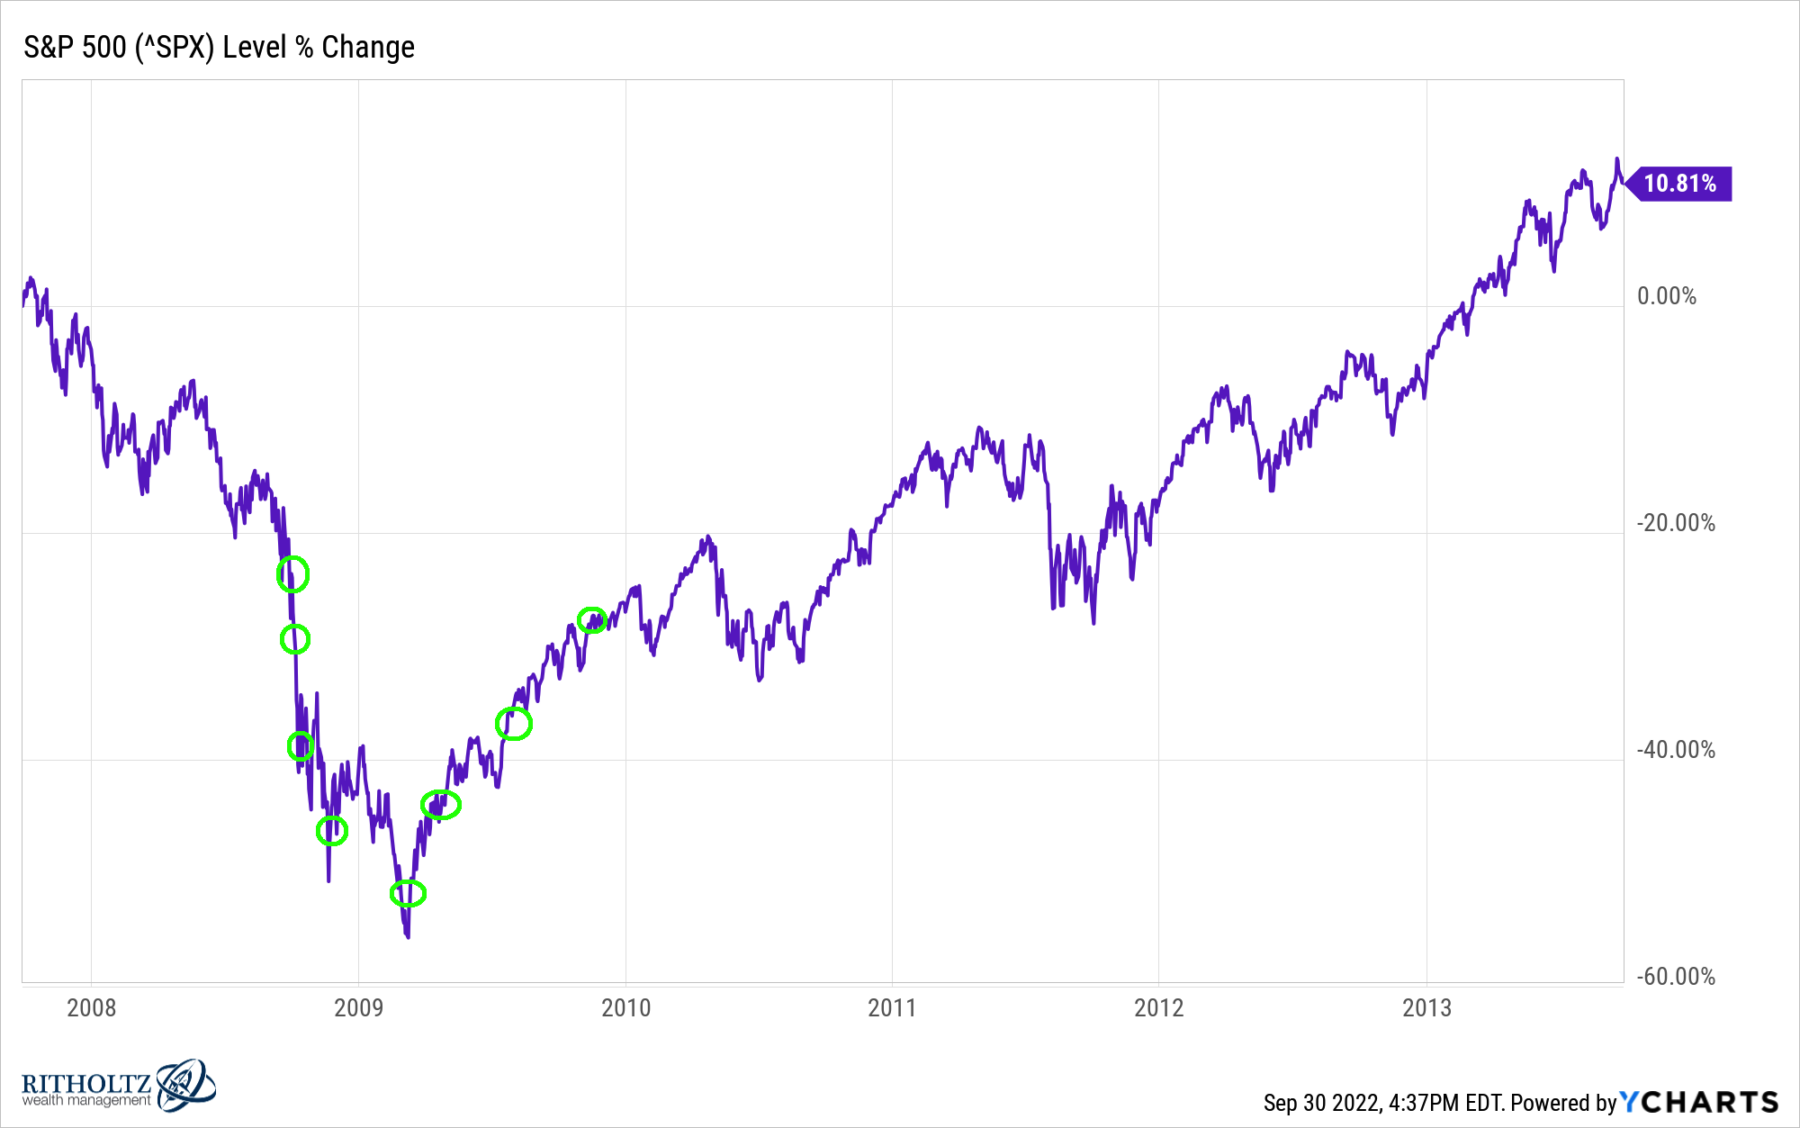
But if you do want to speculate as to the lows, rather than try to nail the bottom, consider scaling in over time. Break up your buys into 5-10 or so pieces. Buy down 25%, down 30ish%, 40-something%, and definitely down >50%. And once the rally starts,1 continue buying by pyramiding your winning positions, adding to them as they work out.
Query: Which of these two approaches do you suspect is more likely to work out for you?
Genius bottom tick (2007-09):
Buying on the way down and on the way up (2007-09):
Close to a bottom?
There are anecdotal examples all around: Consider the Noble Absolute Return ETF (symbol: NOPE). It is a new Long/Short ETF that was launched this week and currently has just 4 holdings: Cash (84%), Proshares Short Nasdaq QQQs (6%) Short Cathie Wood’s ARK Innovation ETF (5%), and Short S&P500 (4%).
Ask yourself if Wall Street is more likely to introduce products of this sort at market tops or after a big move down, and much closer to the bottoms…
UPDATE: October 1, 2022
I accidentally edited out the reason for the title: I went to a very exciting Mets game this week; I was looking for a time metaphor to reflect when something is closer to the end than the beginning: Halftime felt too middleish, the 17th hole too late, 3rd quarter too broad. The 7th Inning Stretch came to mind — and it seemed just right. Guess we will find out how accurate that is in a few months…
UPDATE 2: October 1, 2022
To the UK reader who asked: The 7th Inning Stretch is in the middle of the 7th inning; after the 13th of 18 half innings, or ~72.22% through a standard 9-inning game.
See also:
Washout (Batnick, September 27, 2022)
Some Thoughts on Bear Markets (Carlson, March 11, 2022)
Previously:
Countertrend? (August 15, 2022)
Hindsight Capital (April 27, 2022)
One-Sided Markets (September 29, 2021)
End of the Secular Bull? Not So Fast (April 3, 2020)
Don’t Panic! (with apologies to Douglas Adams) (March 9, 2020)
_________________
1. Look for a classic volume and breadth thrust…
