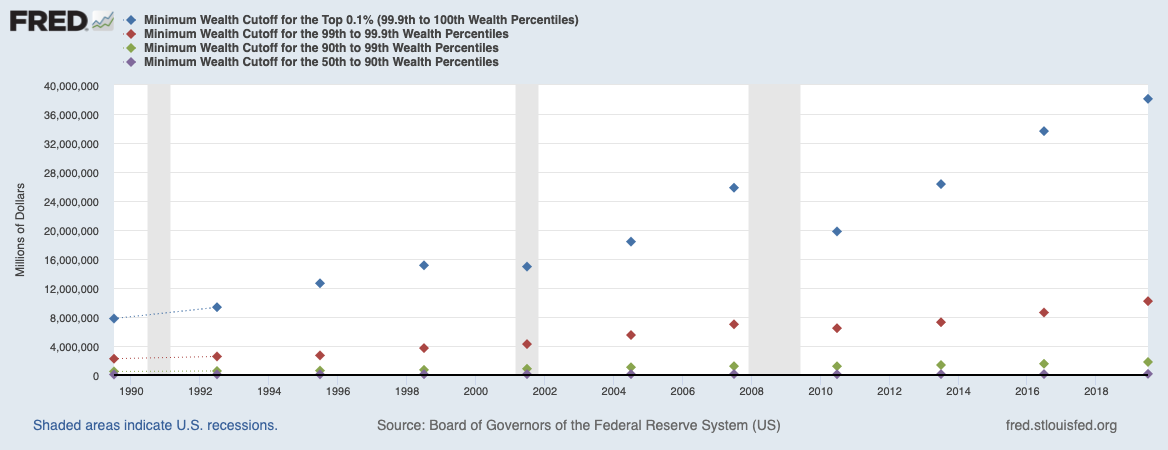
I was working on a longer piece about which economic strata the Fed has the greatest impact on (its more complicated than you might think) when Invictus DM’d me this amazing FRED chart. We looked at this idea earlier this year, but it’s worth revisiting.
Using data from the Federal Reserve, FRED analyzed 5 categories: Top 0.1%, the rest of the top 1%, the rest of the top 10%, the rest of the top 50%, and the bottom half. (Note this data is updated every 3 years, and the chart above runs through 2019).
To be in each category required a minimum wealth of:
$38 million for the top 0.1%;
$10 million for next 0.9% (the rest of the top 1%)
$1.8 million for next 9% (rest of top 10%)
$165,382 next 40% (rest of top half)
0$ for the bottom 50%
The most interesting observation to me: “It’s harder, relatively speaking, to move from the bottom 50% into the top 10% than it is to move from the top 10% into the top 0.1%.” And, “the threshold to get into the wealthiest 10% has risen noticeably faster than the thresholds for the other brackets.”
It’s all quite intriguing with deep societal ramifications. More on this later this week…
Previously:
The Super Wealthy versus the Merely Rich (February 7, 2022)
Wealth Distribution Analysis (July 18, 2019)
Wealth Distribution in America (April 11, 2019)
Composition of Wealth Differs: Middle Class to the Top 1% (June 5, 2019)
No, Your iPhone Does Not Make You Wealthy (June 4, 2018)
Wages in America (2013-2021)
Source:
Moving between wealth brackets: Minimum cutoffs from the Distributional Financial Accounts
The Fred Blog, December 5, 2022


