
I have a vivid recollection of the period following the Great Financial Crisis: I spent March to September of 2008 writing Bailout Nation and the post-Lehman collapse revising and updating the manuscript. The first two months of ‘09 were spent editing, and off I went on a well-deserved vacation in late February.
When I finally came up for air, markets had been cut in half (peak to trough down 56%) and every sentiment indicator I tracked was the most extreme they’ve been in my professional lifetime. “Cover your shorts and go long” was not a difficult call.
What was difficult was the subsequent onslaught of nonbelievers – those bears who after the market bottomed in March 2009 and began moving higher, refused to believe what they were seeing. The rest of ‘09 saw a fierce rally of 63% in the S&P500 from the March 6th lows; the full calendar year gained +23.5%.1
In 2010, markets gained 12.8%.
When 2011 saw a flat S&P 500,2 the negative narratives took on a greater urgency.
But that entire 31-month move was filled with angst and narratives of disbelief. If you were not actively trading or investing back then, let me inform (or remind) you of the storylines that dominated the media:
1. This is nothing more than a Dead Cat Bounce, which will quickly run out of steam as the bear market reasserts itself;
2. We are not merely looking at inflation but hyperinflation as a result of these FOMC policies;
3. Equities never got back down to single digit PE ratios which is how we know this is a terrible entry to stocks.
4. The Fed’s many credit facilities has distorted the marketplace, but that will only carry us so far and the bottom will drop out any day;
5. ZIRP/QE are forms of financial repression that ultimately will fail leading to the next crash;
6. 2008-09 was just the first leg down similar to 1929; the real damage will come in the 1932 crash (circa ~2011-12).
There were many more narratives, but those above are enough to prove the point. Suffice it to say that none of the scary stories promising recessions, crises, recessions, disasters, or worse ever came to be.
Then came 2012, up 13.4%; 2013 was the year that the S&P 500 broke out to highs above the pre-GFC peak, signifying a new bull market.3 The markets gained +29.6% on the year.
A decade later, COVID-19 and the response thereto, plus an aggressive, belated rate hiking cycle changed the investing regime.
~~~
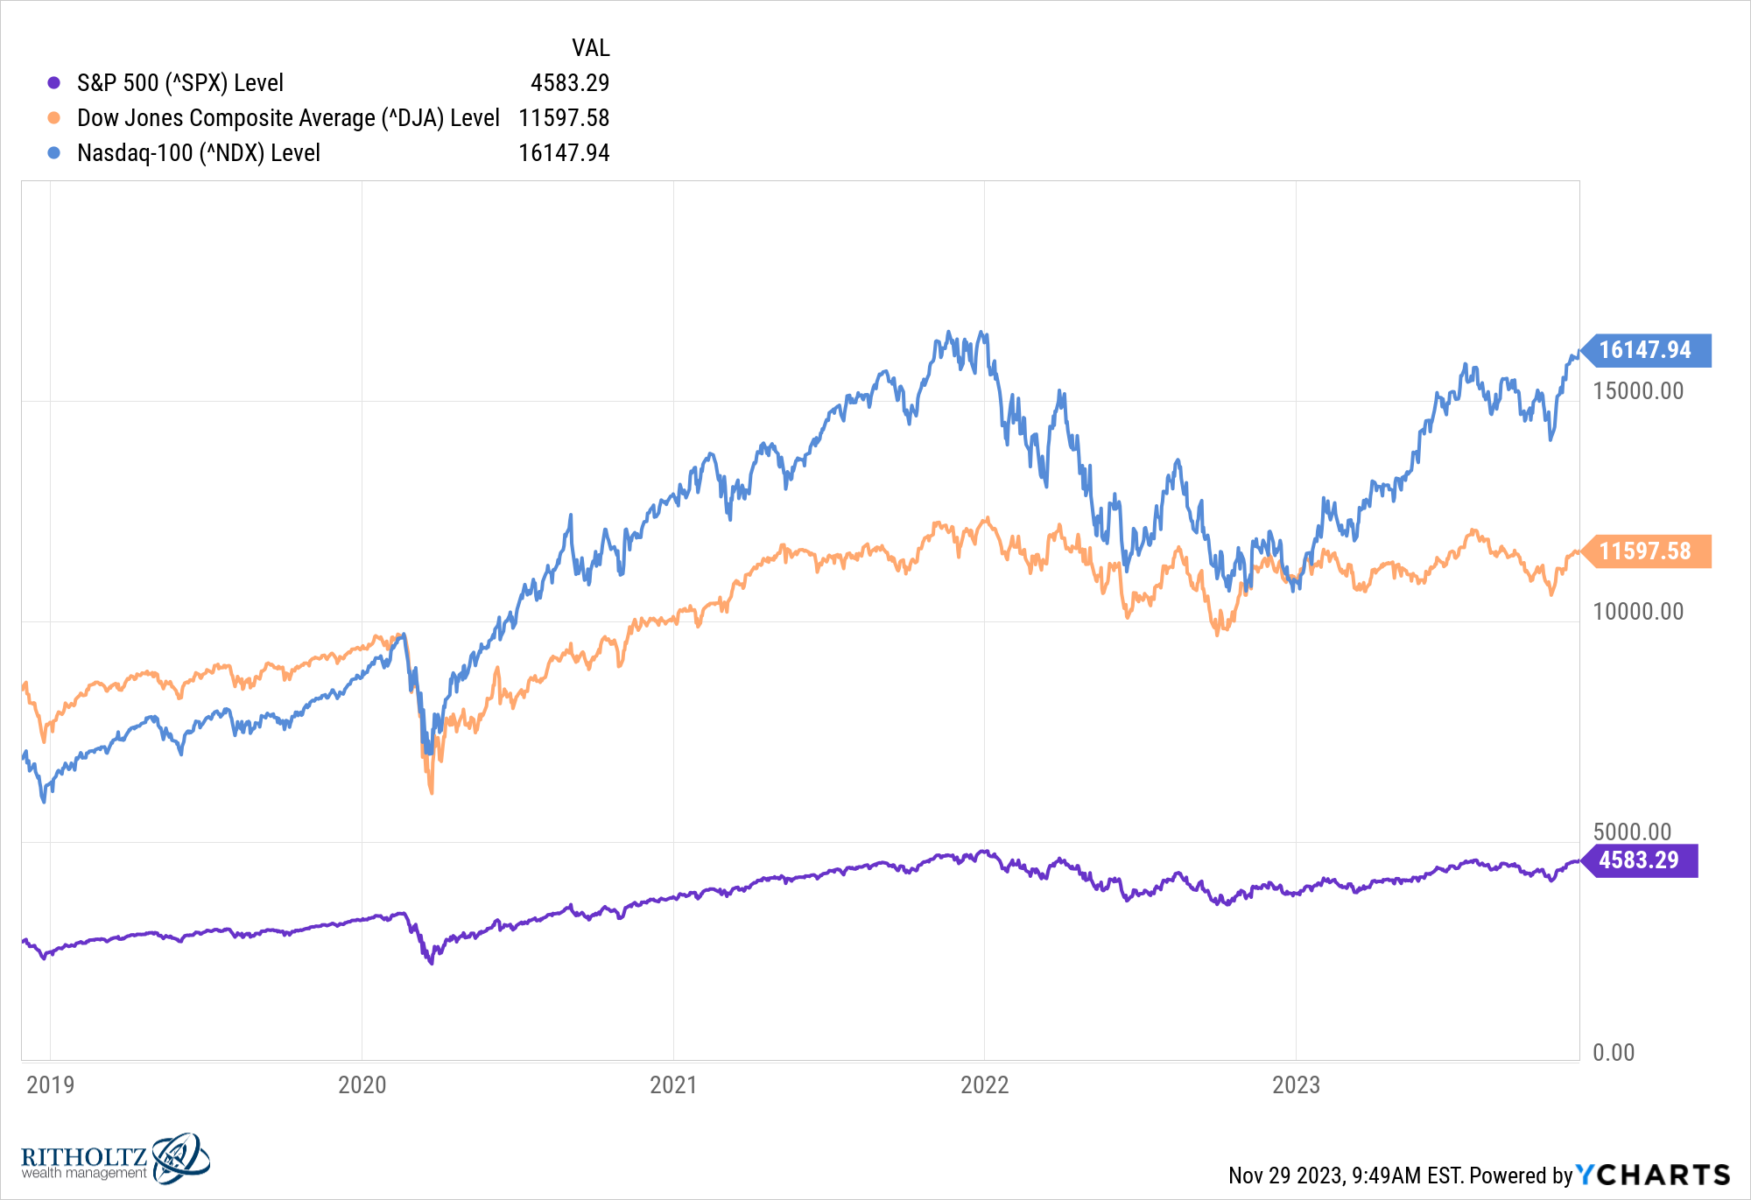
One cannot help but notice a similar set of circumstances today, 41 months after markers made their pandemic lows on March 26, 2020. We sit a few percentage points away from the pre-pandemic highs (see chart above). Sentiment is negative, disbelief is rampant, and this is the most hated rally since the move off of the 2009 lows.4 Three years later, pundits were asking the same question: How hated is this rally?
JC Parets of All-Star Charts points out that “The stock market is having a historic year. The S&P500 is up over 20% so far, with one of the best months of the year still ahead. The Dow Jones Industrial Average is just 2% from new all-time highs.” He adds the Nasdaq has done even better, up 46% for 2023 with a month left in the year, and the VIX is pushing 4-year lows down to 12.
Today, we have Russia and Hamas starting hot wars in Ukraine and Israel; 2010s had Brexit and the threat of the European Union collapse.5
Of course, no two rallies or bull markets are ever identical: Stocks ain’t exactly cheap, rates have trended higher (not lower) and the Russell 2000 cannot get out of its own way.
But the two eras raise similar questions for traders: Are you too bullish, or not bullish enough…?
Previously:
The Most Hated Rally in Wall Street History (October 8, 2009)
How Hated Is This Rally? (September 10, 2012)
Round Trip: Lessons From the 2022 Bear Market (August 1, 2023)
Understanding Investing Regime Change (October 25, 2023)
See also:
Investors are still sad
JC Parets
All Star Charts, November 28, 2023
__________
1. That is price only; the 2009 total return with dividends was +26.5%.
2. 2011 total return was +2.1%
3.Technicians and others normally do not count the recovery rally off of the lows as part of the new bull market; rather they are merely getting back to break even. This is why the 1982-2000 rally is not dated to the lows in 1973…
4. I first used that phrase on October 8, 2009, and it took off.
5. The domestic political climate post-January 6th and the rise of authoritarianism/popularism is different than the post-GFC era…
