The Fed held its benchmark Federal-Funds rate steady yesterday at 5.25% – 5.5%, leaving the possibility of cuts in the future. Jerome Powell repeated his “Data Dependent” mantra. “Persuasive evidence” that higher interest rates were no longer necessary to bring down inflation is what the FOMC wants, and today I want to share a few pieces of that evidence.
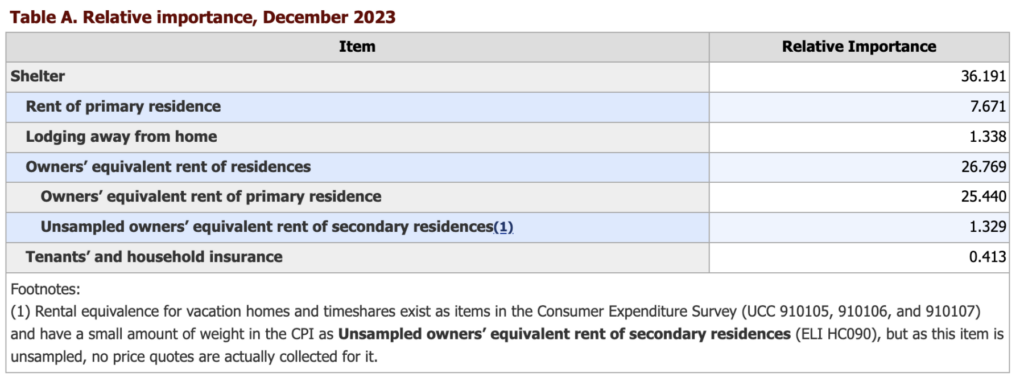
Our starting point is the shelter component of the Consumer Price Index. At about 40%, Shelter is the largest portion of the CPI. As the Bureau of Labor Statistics (BLS) explains:
“The data used as inputs in the construction of the index for shelter, as well as the indexes for rent and OER, are collected in two surveys. The Consumer Expenditure (CE) Survey asks households the share of their budget which goes towards different categories of goods and services, and is subsequently used by the CPI program to create weights for index estimation. The Housing Survey collects price observations of rental housing units across the United States.”
Here is the BLS table showing the weighting:
Let’s hold the problems with survey data for another post, and instead zoom in on actual measures of rents.
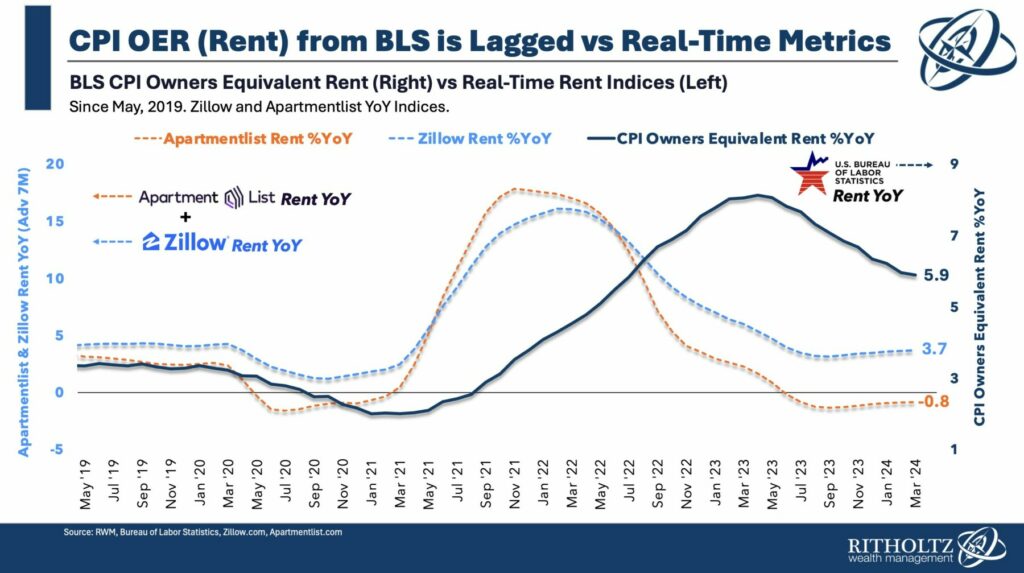
As our chart (top) shows, the CPI model that measures rent year over year appears to lag other real-time measures by 18 months. The Apartment Rent Index peaked in November 2021 at ~17% year over year; as of April 2024 its down -0.8% year over year. The Zillow Observed Rent Index, with a different mix of rental apartments and houses, peaked around March 2022 at about 15%; it is now at about +3.8% year over year.
BLS measures of Shelter peaked much later, around May 2023 — a lag of 14-18 months. There are several technical reasons why OER lags so much in the BLS measure of shelter inflation — some of the lag is in how the BLS data is collected and assembled, but hold that aside for a moment. I want to focus on a very important aspect that makes the BLS measure of shelter inflation data so different from the observed rents like the Apartment Index and Zillow.
In a word, Renewals.
Almost two-thirds of all existing leases for apartments or house rentals get renewed. Nearly all of these renewals were signed one or two years ago. Leases are contracts, and they lay out the specific terms for renewals within the document.
What rates do you think landlords built into their lease renewals 12-24 months ago when they were drafting and negotiating those 2022 and ’23 leases? They obviously reflected the inflation rates then — which were peaking.
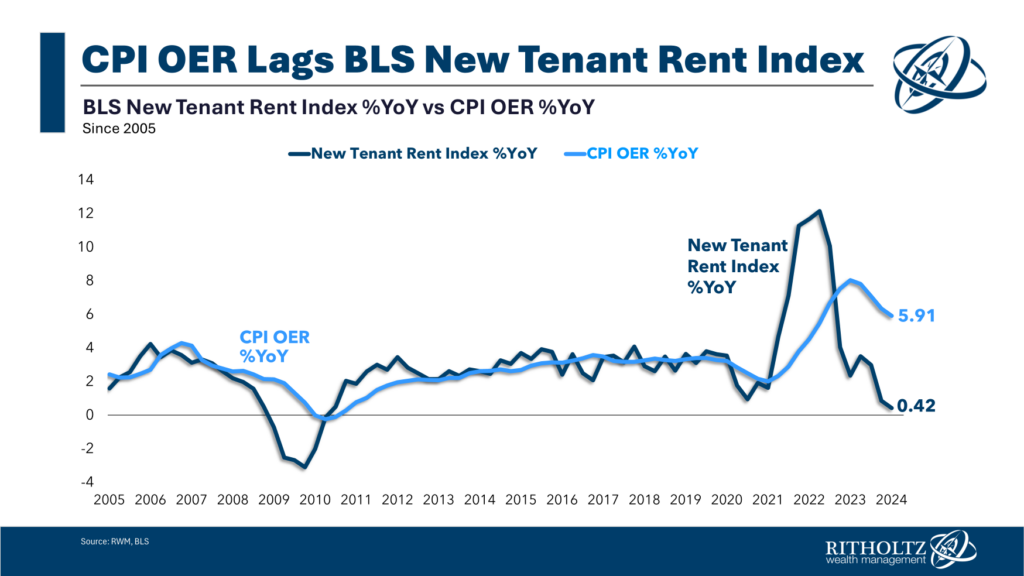
What do contracts negotiated and executed two years ago have to do with the rate of inflation today? You might assume “nothing,” but as we see in the BLS data, it has an outsized impact. It is very visible in BLS’ New Tenant Rent Index — that data, unlike OER, does not include renewals.
No surprise, it too peaked in 2022, and is now at +0.42% year over year:
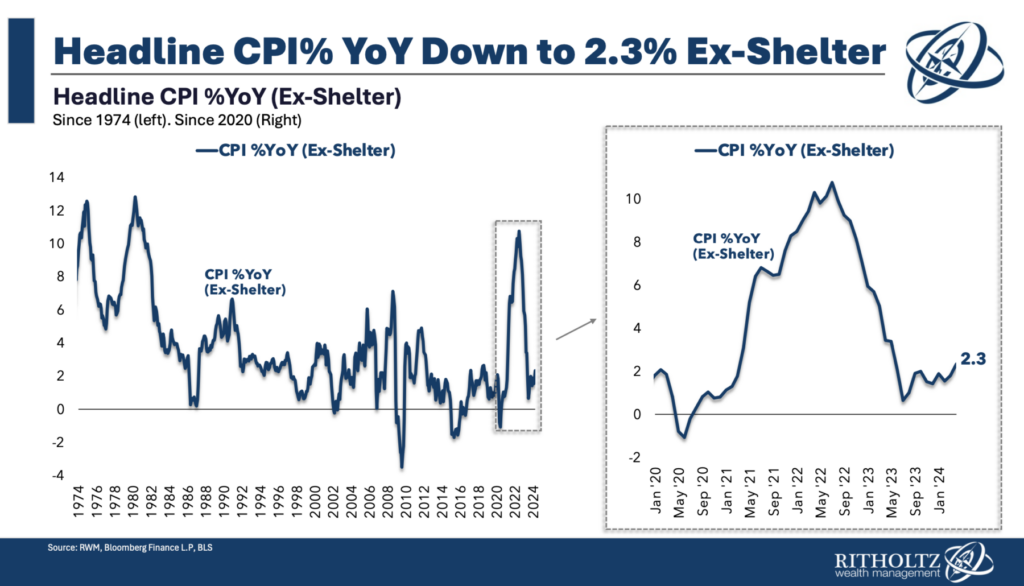
Back out shelter, which is overweighted by renewals, and the CPI is at 2.3%:
Where the rubber meets the road is in mortgage rates: 61% of all homeowners have a mortgage; of those homeowners with mortgages, 78.7% have rates at or below 5%. Consider also 59.4% are at or below 4%. It should be well understood by now that these rates have become golden handcuffs, locking people in place who might want to move (trade up, new location, etc.).
Going from a 3.75% mortgage rate to current rates of 7.5% will increase your monthly payments by about 50% — for the same-priced house! Imagine moving up to a more expensive house — one that might be larger or in a nicer neighborhood; it would double or event triple your mortgage expenses even for a modest increase in price.
This is why single-family house inventory is down 75% from its peak of 4 million annually to about 1 million today. That lack of supply has kept prices elevated. Higher rates not only are affecting existing home supplies, it is limiting new home construction, and making that more expensive as well.
I said this a few years ago, but it bears repeating here: If the Fed wants lower inflation, they should be lowering rates now.
UPDATE: May 2 2024 2pm
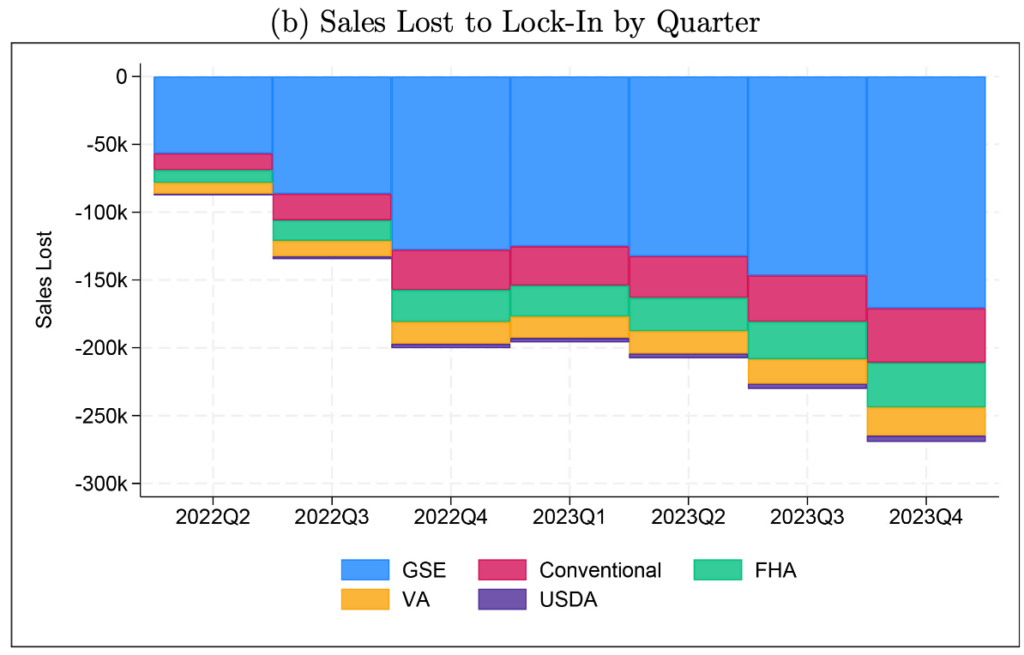
Torsten Slok of Apollo Group points us to this March 2024 FHFA paper (PDF); “Lock-In Effect of Rising Mortgage Rates:”
“This paper finds that for every percentage point that market mortgage rates exceed the origination interest rate, the probability of sale is decreased by 18.1%. This mortgage rate lock-in led to a 57% reduction in home sales with fixed-rate mortgages in 2023 Q4 and prevented 1.33 million sales between 2022 Q2 and 2023 Q4. The supply reduction increased home prices by 5.7%, outweighing the direct impact of elevated rates, which decreased prices by 3.3%. These findings underscore how mortgage rate lock-in restricts mobility, results in people not living in homes they would prefer, inflates prices, and worsens affordability.”
Previously:
How the Fed Causes (Model) Inflation (October 25, 2022)
2% Inflation Target is Silly (July 26, 2023)
For Lower Inflation, Stop Raising Rates (January 18, 2023)
CPI Increase is Based on Bad Shelter Data (January 11, 2024)
How Everybody Miscalculated Housing Demand (July 29, 2021)
See also:
WSJ: Fed Says Inflation Progress Has Stalled and Extends Wait-and-See Rate Stance.
Stalled Inflation Vexes the Fed. Is It Noise or a New Trend? by Greg Ip, WSJ
The Lock-In Effect of Rising Mortgage Rates, by Ross M. Batzer Jonah R. Coste William M. Doerner Michael J. Seiler; Federal Housing Finance Agency, March 2024 Working Paper 24-03

