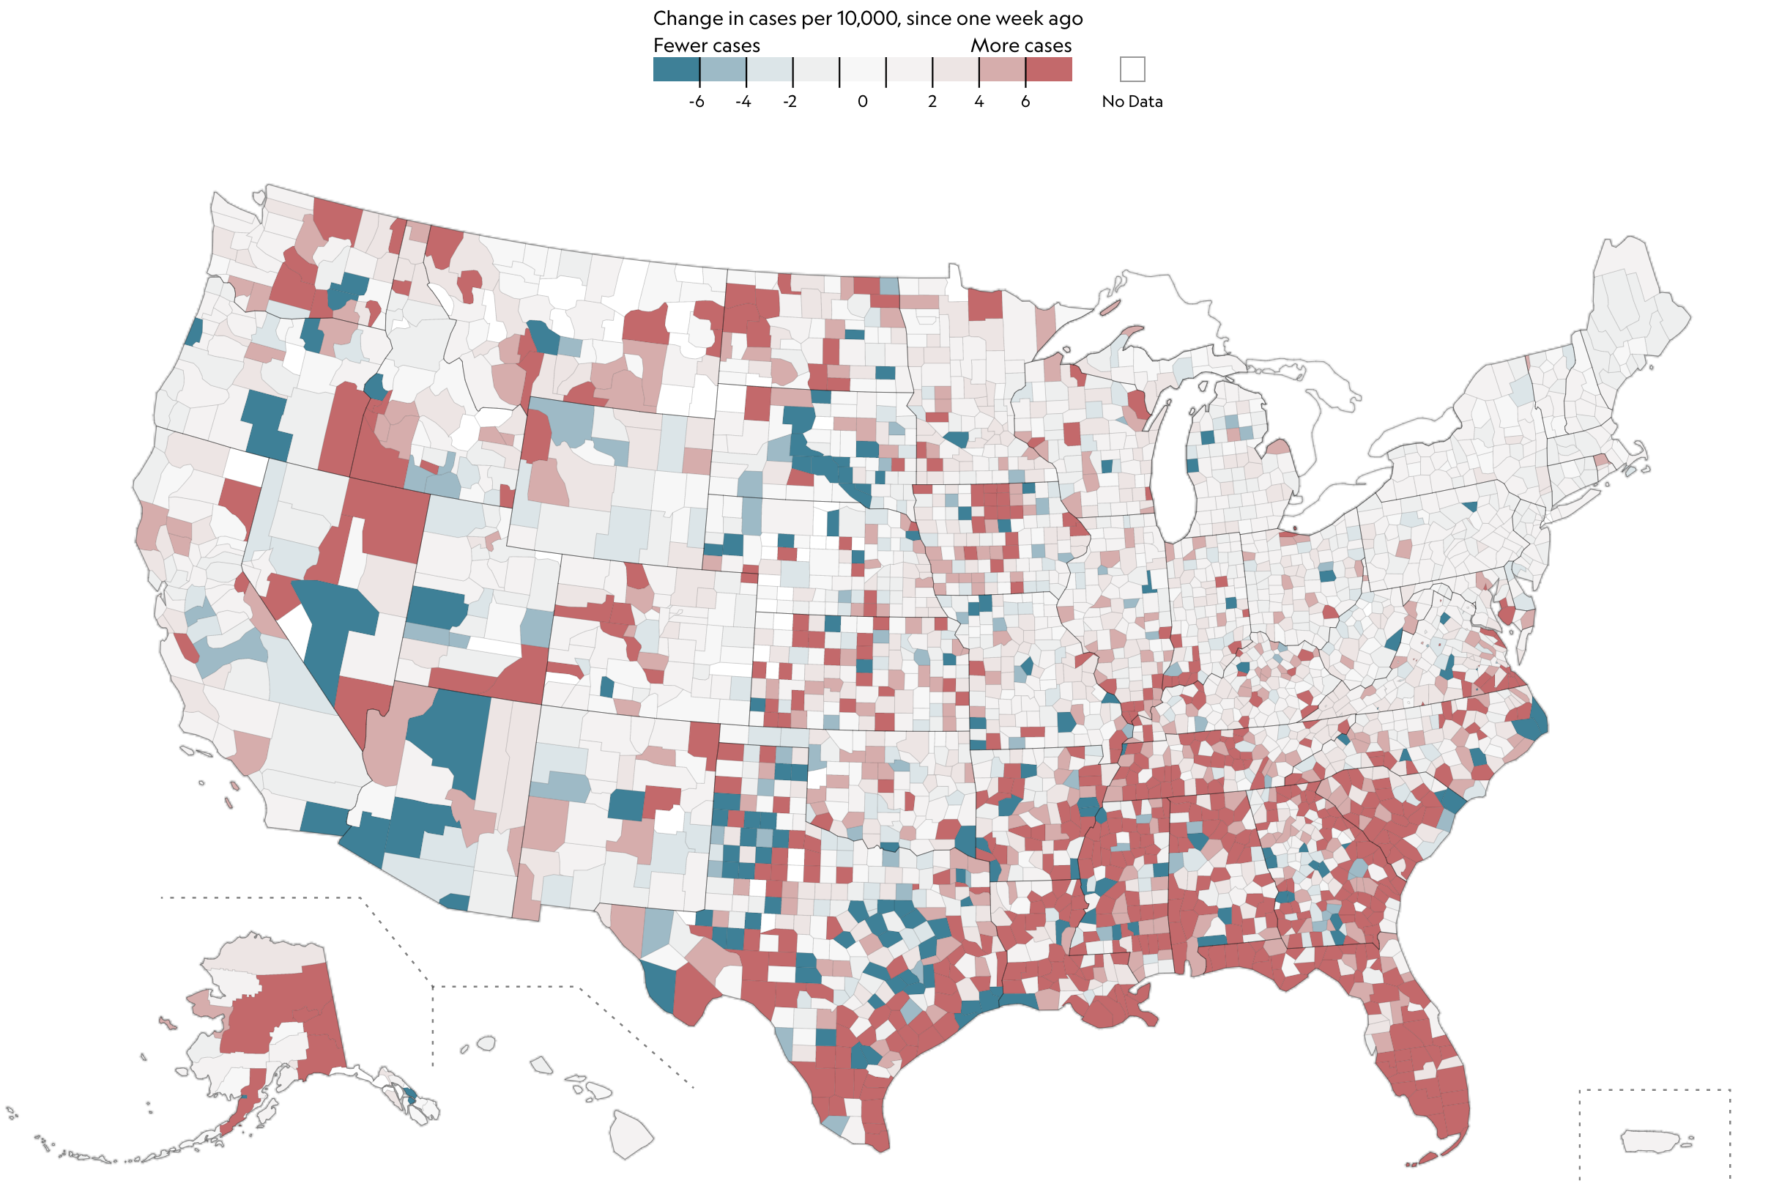
 Coronavirus in the U.S.: Where cases are growing and declining Source: National Geographic The map above from Nat Geo shows...
Read More
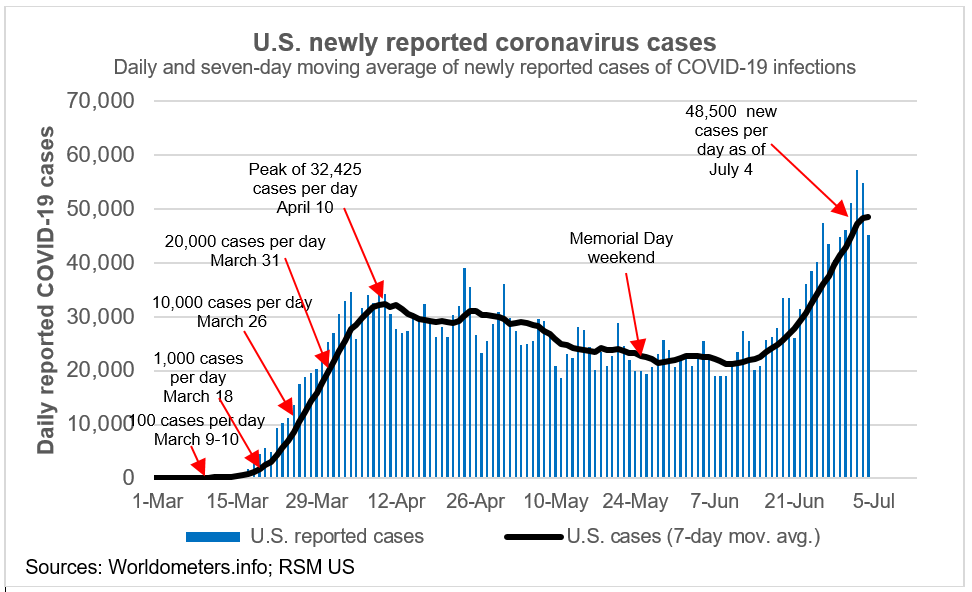 Source: Real Economy Blog Joe Brusuelas does some very interesting work in “the middle market,” e.g., midsize...
Read More
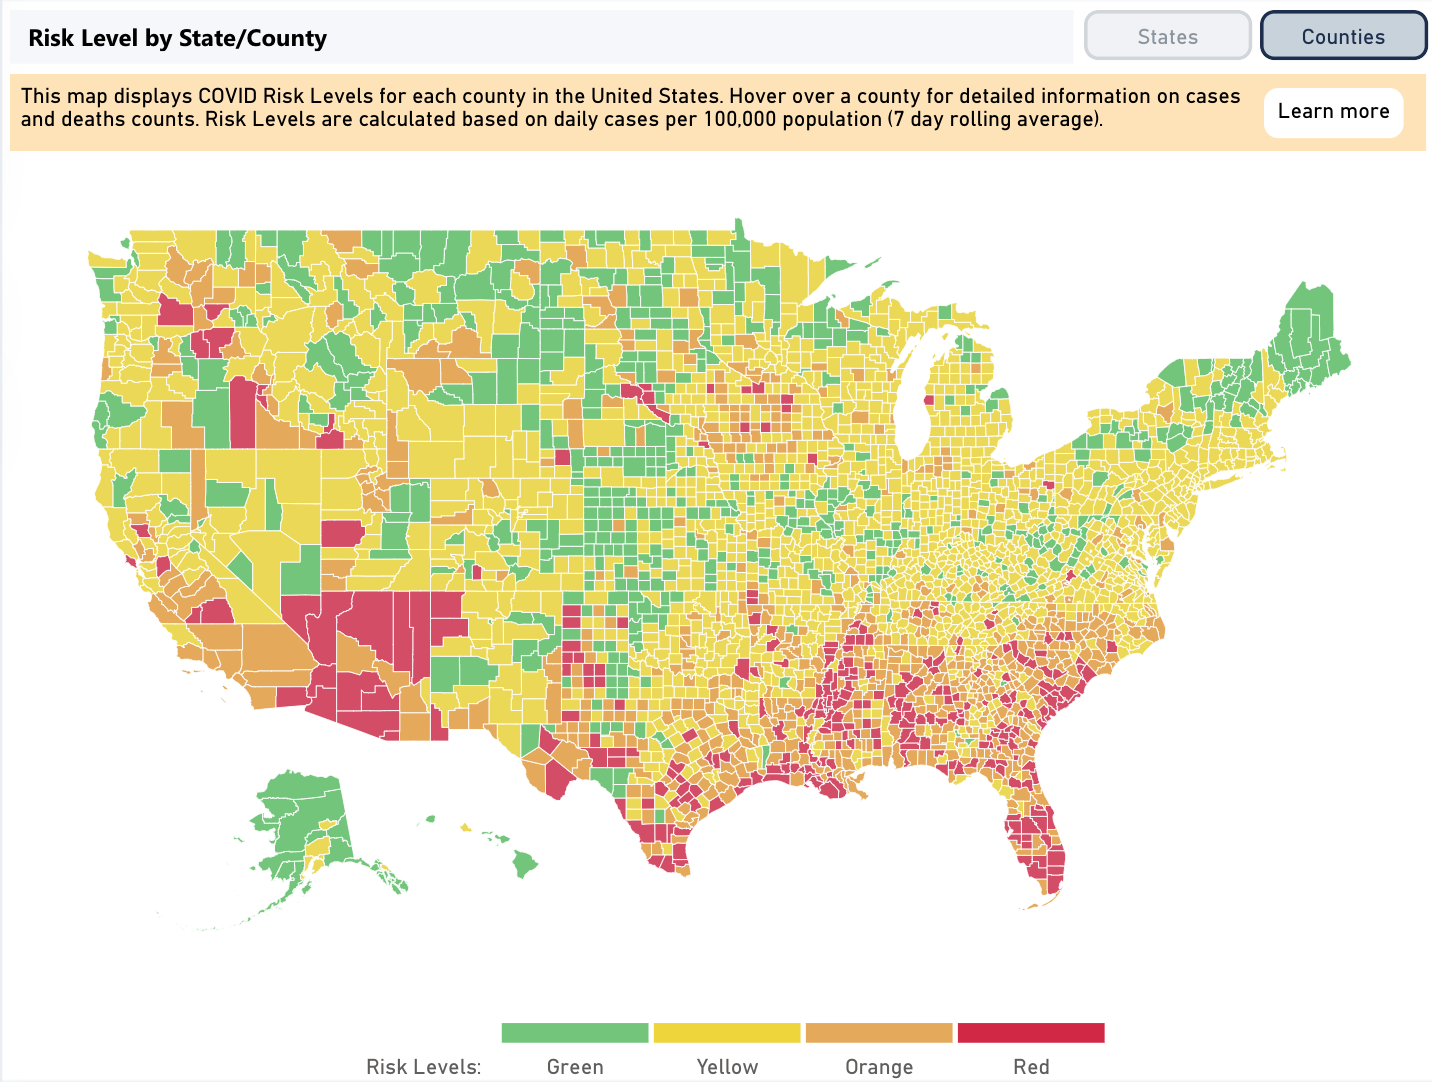 COVID Risk Level Map and COVID Suppression Guidance Source: Pandemics Explained How severe is the pandemic where you live?...
Read More
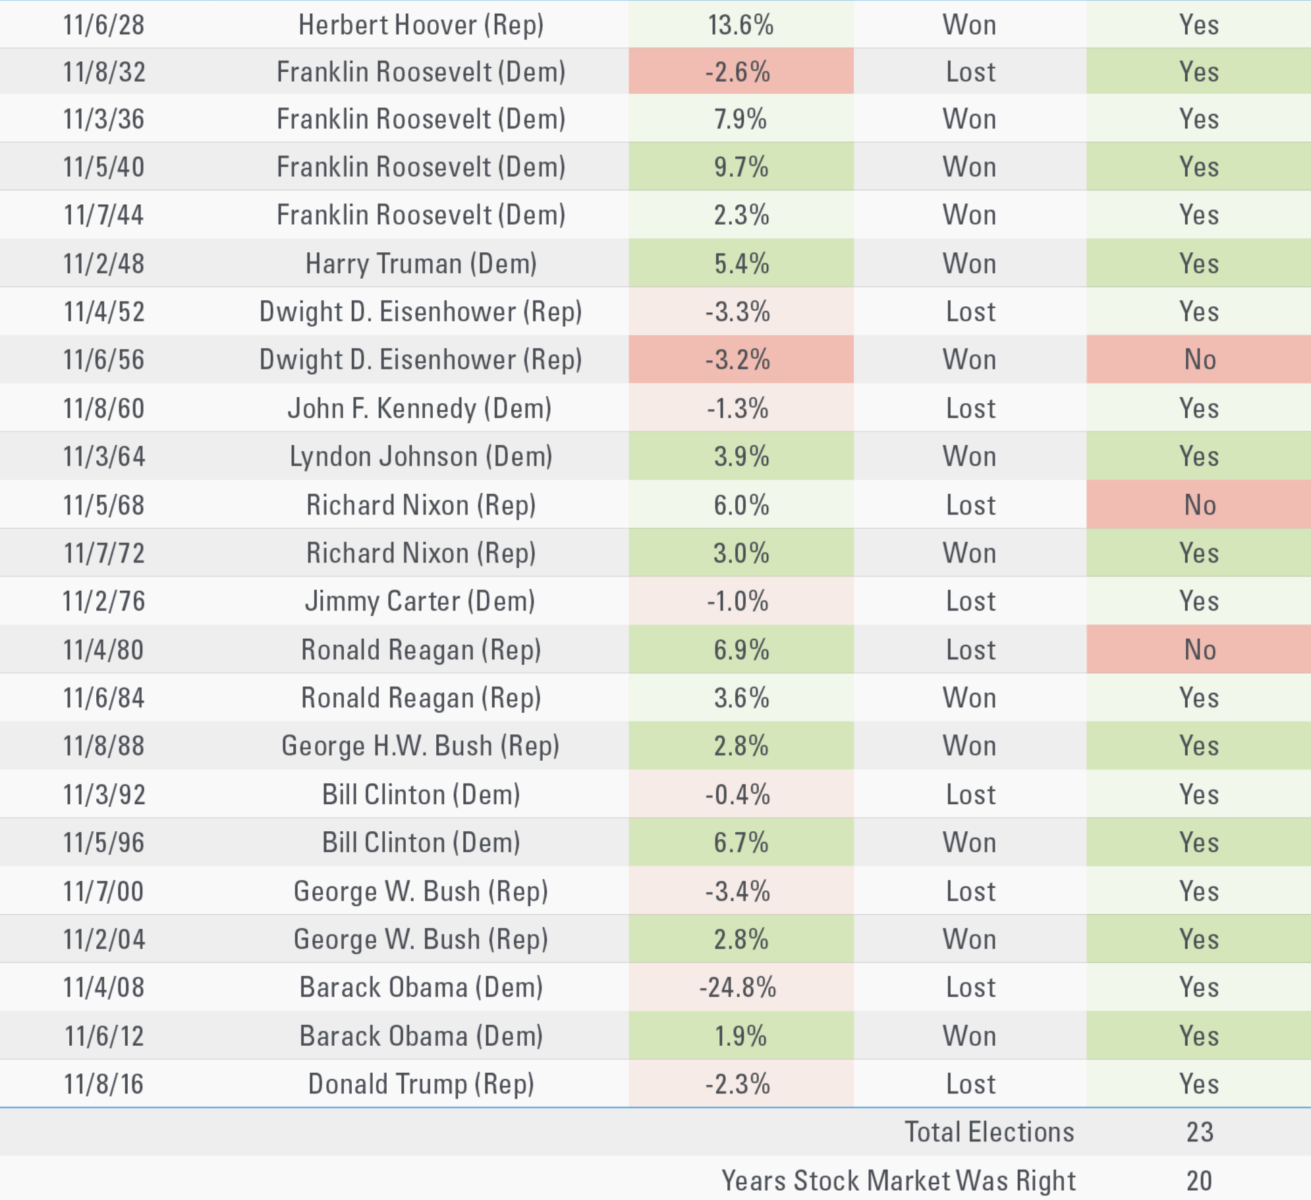 It is part of the American quadrennial experience: Every four years, we elect a new President (and a third of the Senators, and every...
Read More
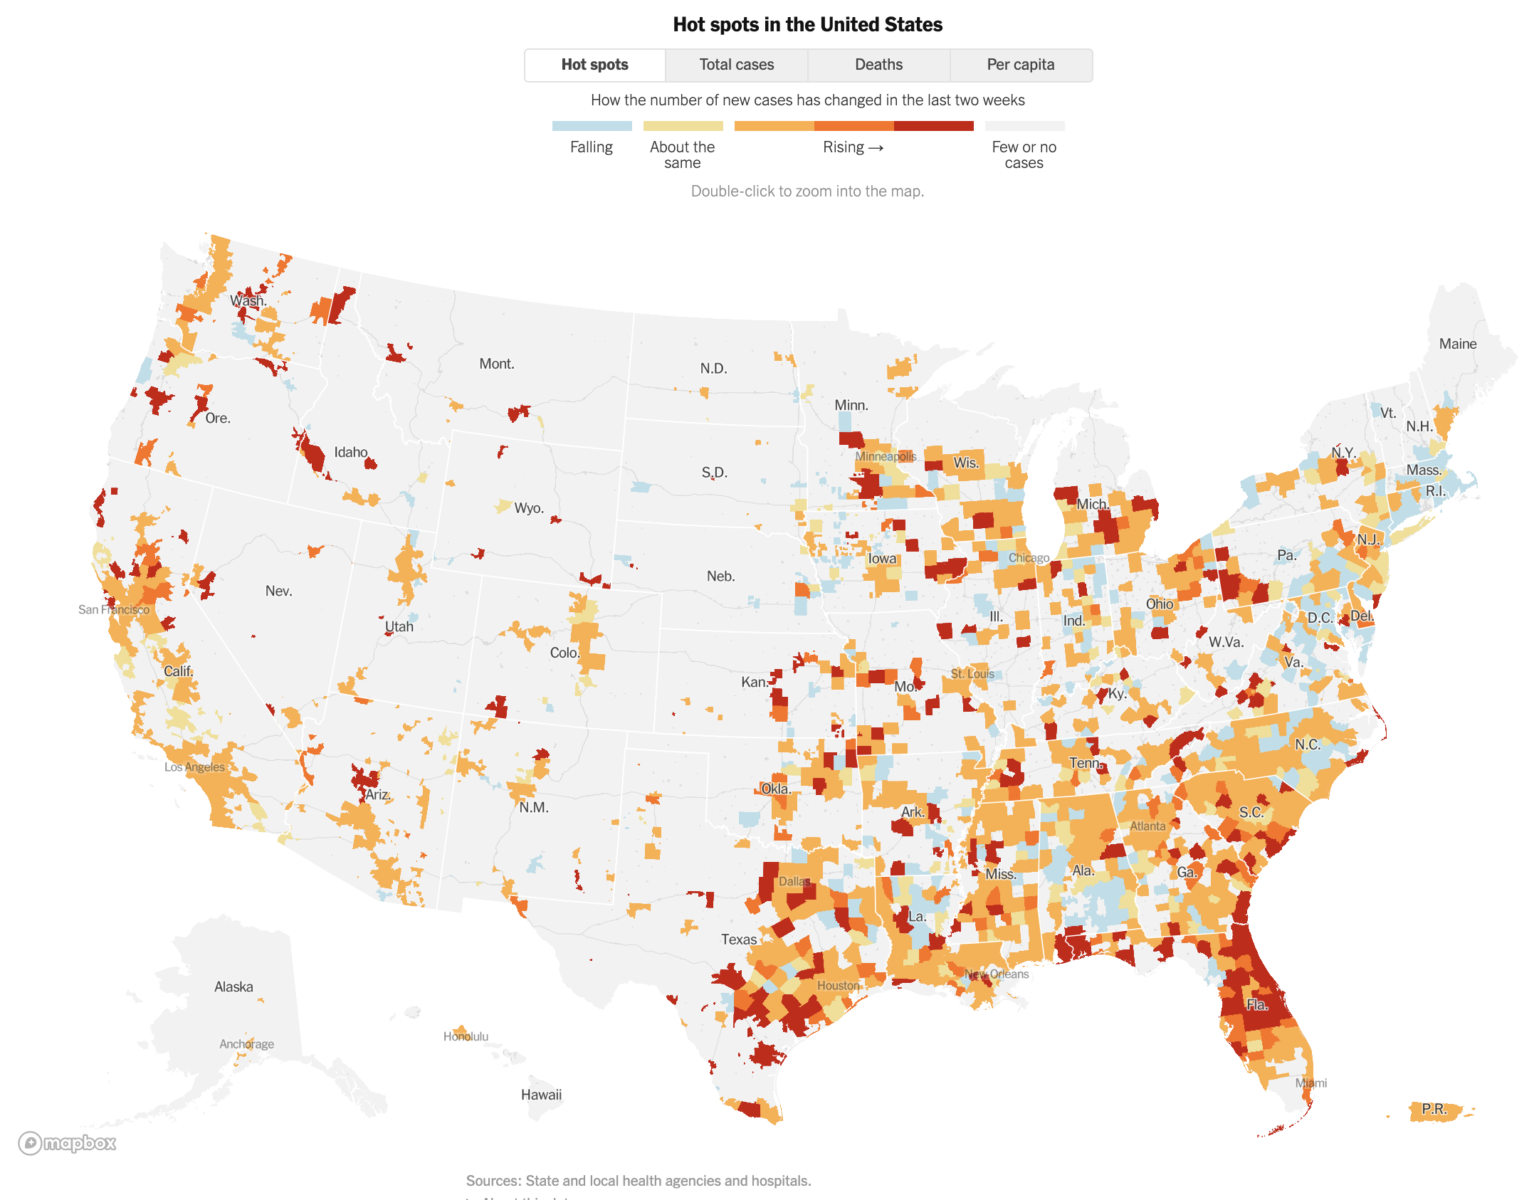 Sources: CDC, NIH, New York Times More than 2,703,200 people in the United States infected with the coronavirus. At least...
Read More
Click play to see update with most recent data included
Read More
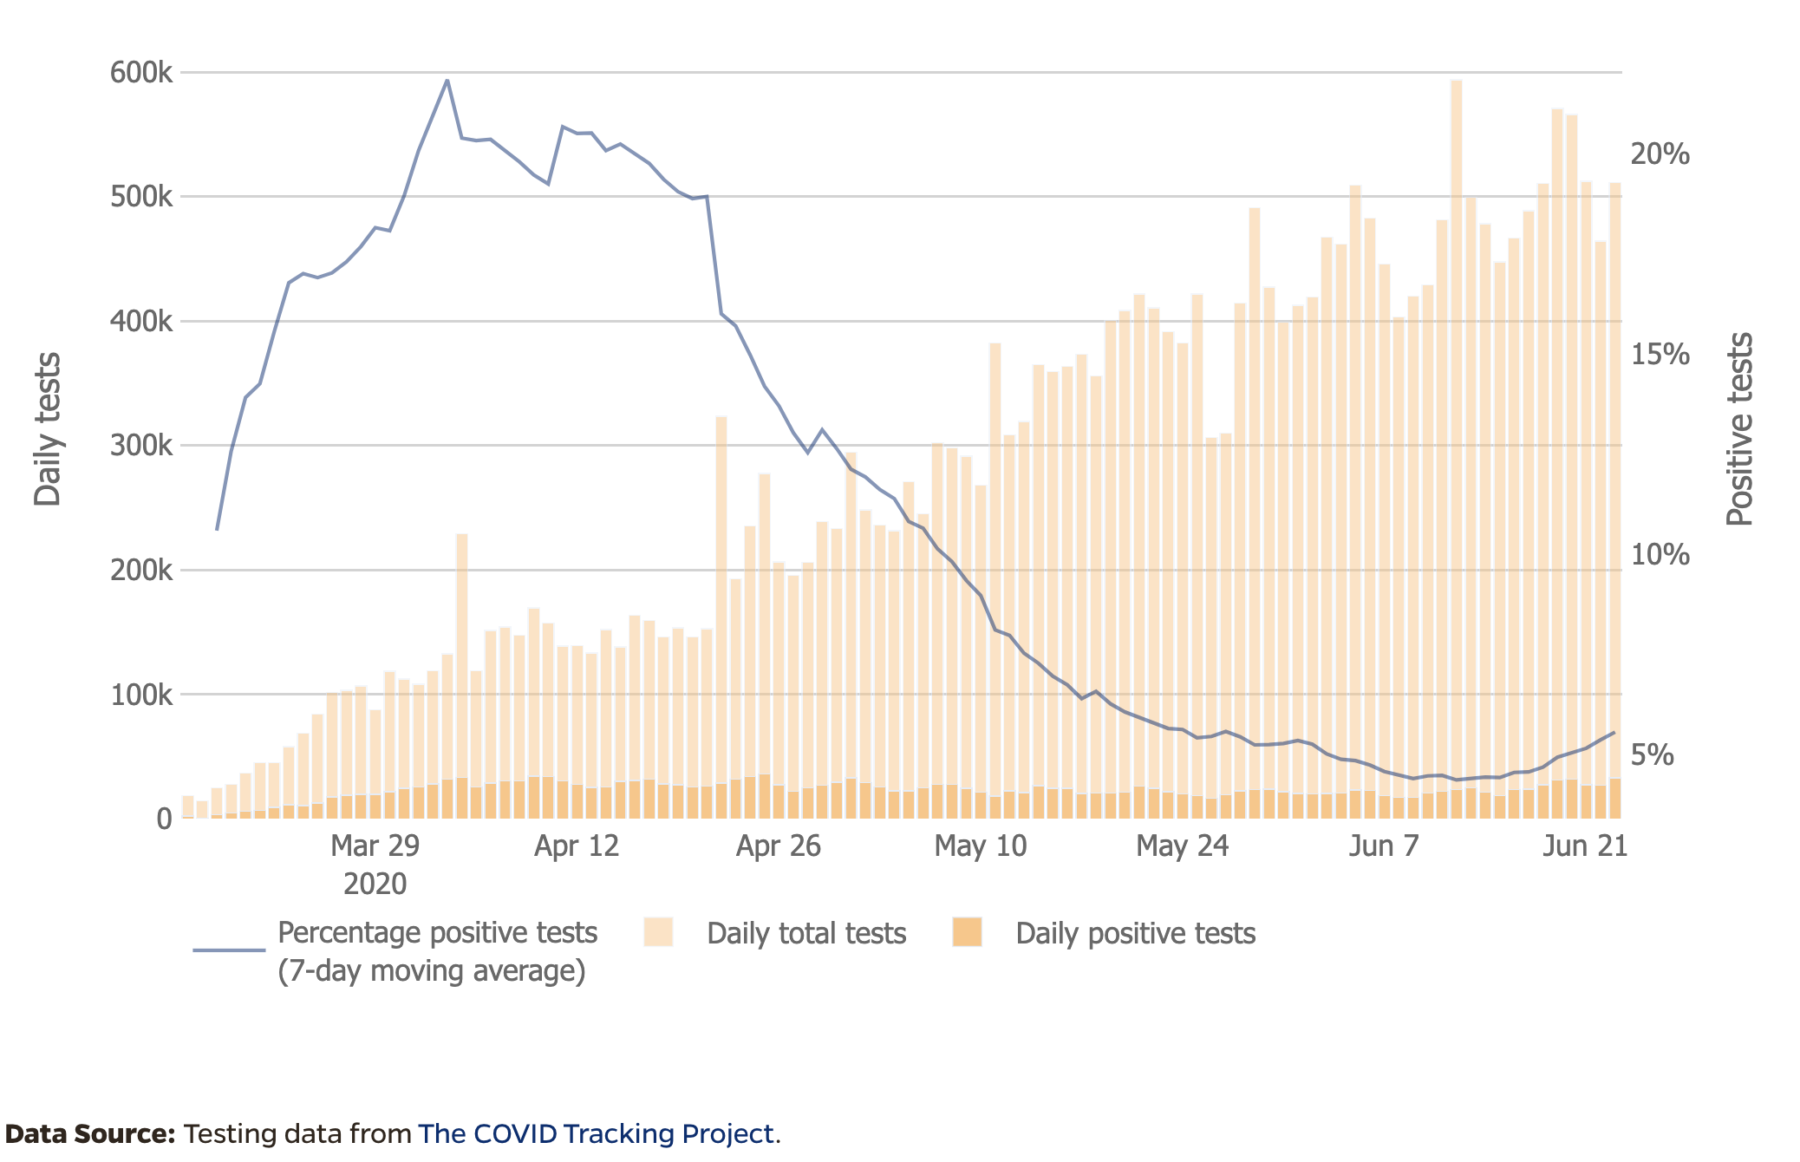 Rate of Positive Tests in the US and States Over Time Source: Johns Hopkins Coronavirus Resource Center So close! In...
Read More
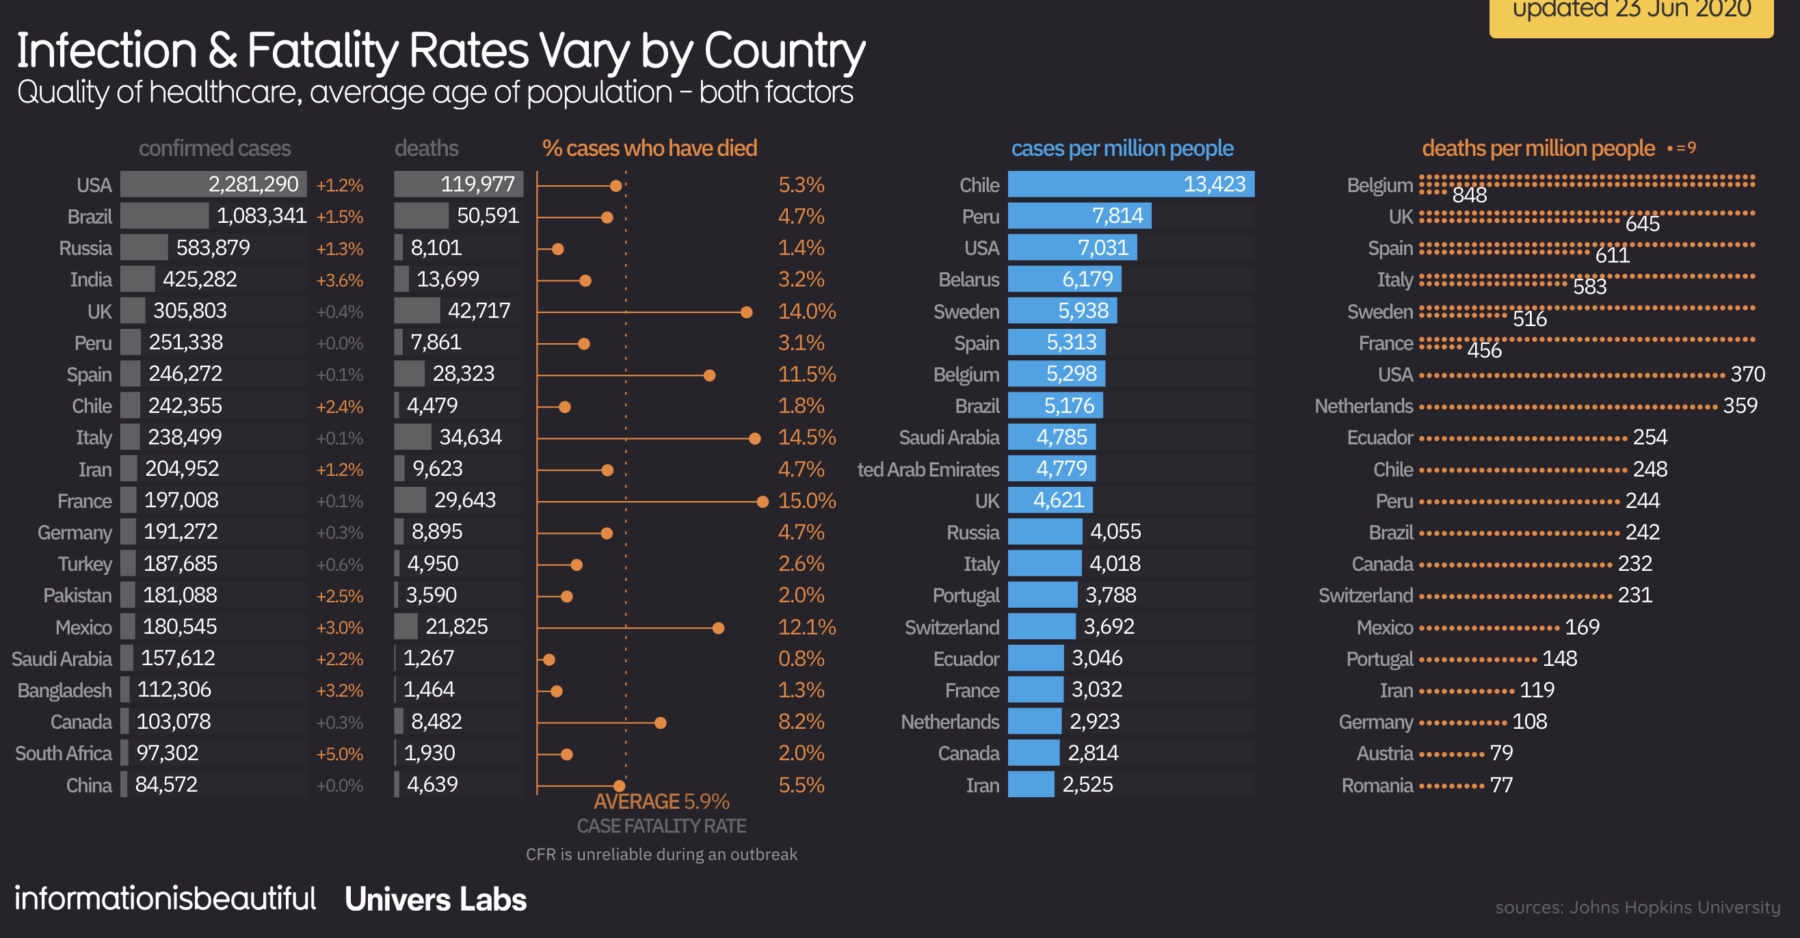 Chatting off air with Jeremy Siegel towards then end of our MiB podcast last week, he mentioned he reviews various pandemic stats each...
Read More
 Here Are the 96 U.S. Cities Where Protesters Were Tear-Gassed Source: New York Time This is astonishing: “At least 99 law...
Read More
 Source: How We Reopen Safely Really nice collection of analytics and charts at How We Reopen Safely I especially like the...
Read More
 Coronavirus in the U.S.: Where cases are growing and declining Source: National Geographic The map above from Nat Geo shows...
 Coronavirus in the U.S.: Where cases are growing and declining Source: National Geographic The map above from Nat Geo shows...


