
Source: Episode
Interesting look showing how various shocks impacted volatility trading over the past 27 or so years.
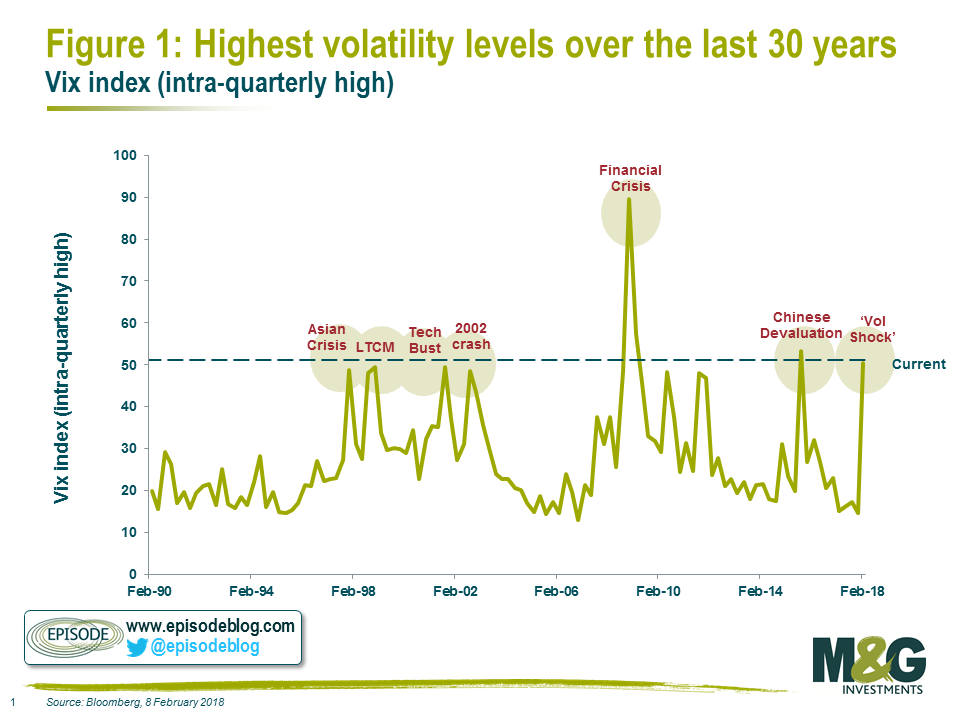
M&G, the folks behind the above chart, note that:
“There have been only three phases in last 25 years when the S&P500 has moved this rapidly in this short a period of time, a fact drawn to my attention by my perceptive colleague, Marc Beckenstrater (see figure 1). Similar moves in the last 25 years have coincided with genuine events. The Asian crisis, the tech bust, and the GFC.”
The February event occurred for what we now know believe were specific reasons: the collapse of the leveraged-short-volatility notes, a widely held position among some hedge funds. We discussed this in some detail last month (Why 2018 in Markets Feels So Awful), noting (my explanation of why the VIX notes unwound is after the jump)
I don’t see that event as a indicating the economy is deteriorating; nor do I see the signs of a marker top. Note that a robust economy that withstands a blow is healthy. As ECRI’s Lakshman Achuthan notes, weak economies are tipped into recession by even a modest shock.
I have written about the subject of how market tops are formed in the past; this does not have any of those characteristics (yet).
My reasonable explanation:
“My best guess is that someone somewhere back in February decided enough was enough — it was time to take their chips off the table. For some historical perspective, let’s look back to December 2006, when the VIX, which is sometimes referred to as the market’s fear index, hit a cyclical low of 9.39, just as the housing market began to stumble and stock markets were beginning their final run-up ahead of the Great Recession and a subsequent 57 percent crash. For anyone looking for a technical signal that the moment had come to unwind a levered VIX trade, that time was as good a time as any.
As the VIX was getting closer to its record low of 8.56 in November 2017, my guess is a chain of events led large holders of the leveraged volatility notes to start cashing out. A trickle at first, then a flood. As so often happens, selling begat more selling, especially with this highly leveraged trade. Pretty soon, a vicious volatility cycle was underway. It wasn’t an outright panic but rather gradual selling that fed on itself, playing out over a few months, from November to February, when the VIX spiked to 50.3.”
