
The Bull Market Actually Isn’t 10 Years Old
The worst ended in 2009. But save your birthday wishes for March 28. And bring six candles to the party.
Bloomberg, March 12, 2019
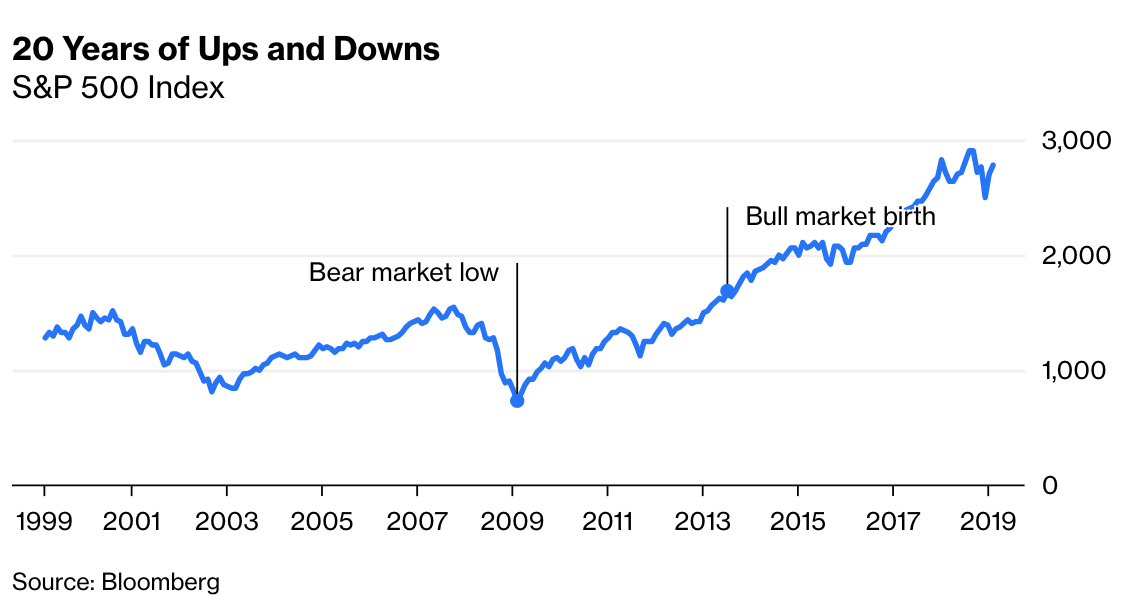
A decade ago this month, major market indexes hit their lowest points before reversing as sellers exhausted themselves amid the fear provoked by the 2009 financial crisis.
The S&P 500 Index marked 666 as its low. The Nasdaq and the Dow Jones Industrial Average made fresh lows and reversed as well. With the economy in free fall, after four months of reporting monthly job losses of more than 700,000, the U.S. Department of Labor disclosed that 800,000 jobs disappeared in March 2009.
Then things started getting better, and much of the financial press – see this, this, this, or this – has proclaimed March 9th to be the birthday of the bull market that has dominated the last decade.
But it isn’t. The real bull market didn’t take off for another four years, a fact that has real significance both as a matter of historical record and for its impact on today’s market psychology.
Don’t take my word for it. Search for any authoritative source from the communities of technicians, strategists or quants that convincingly argues that bull markets begin at bear market lows.1 You won’t find it.
There are lots of explanations as to why this is so, but let’s focus on three:
1. Bear markets contain cyclical rallies that fail. When stocks fall to a new low in the midst of a bear market, it may or may not be THE low. We never know where the bear market lows are until after the fact. As I noted in 2003, bear markets contain “vicious rallies and wicked sell-offs — over shorter term cycles — within the larger timeline.” Just look at the secular bear market that ran from 2000-2013 for recent examples.
Perhaps the most instructive case is the bear market that stretched from 1966 to 1982. The Dow kissed 1000 in 1966 and never got higher on a permanent basis until 1982. That period consisted of four rallies of 32 percent, 67 percent, 75 percent and 38 percent — all of which failed. The 2003-2007 cyclical rally saw markets nearly double — it also failed into the teeth of the financial crisis.
There is a reason why hedge funds contain a “high-water mark” before their performance fees kick in: Investors don’t want to pay 20 percent for gains that simply retrace prior moves. To garner those fees, both fund managers and markets need to make new highs.
Of course, we never know this information until long after the fact. Dating the bull market’s beginning to these lows looks more like a case of hindsight bias than anything that might be useful to traders or investors in real time.
2. Bull Markets need to eclipse the prior trading range by making new highs. To understand why new bull markets need to make new highs, consider the prior trading range that came before. These long range-bound markets exist for a specific reason: Prior market highs, especially in bubbles, tend to steal gains from the future. Valuations become stretched, and it can take years for earnings to catch up. These long periods of up-and-down trading allow equities to work off those excess prices. It can take a decade or longer for this to occur.
Consider the enormous secular run of the Japanese Nikkei from 1965 to 1989.2 The period included a 5,000 percent, 30-year increase in real estate prices and a stock market that ended up twice as expensive as the Nasdaq peak in 2000. That massive bubble collapsed in 1989. Traders keep getting caught in numerous Nikkei rallies that failed, despite the prior peak occurring 30 years ago. (The Nikkei is still in a long-term trading range).
It takes a combination of investor psychology and the (technical) exhaustion of sellers at that top of the range for new highs to be reached on a permanent basis. Secular bear markets end when new bull markets begin — the two do not overlap.
3. Dating the birth of the bull markets to bear market lows creates weird anomalies. Consider a few examples of prior bull markets that we do not date from previous lows.
If you want to say that the most recent bull market began during the 2009 lows, then you must also contend that the 1982-2000 bull market began in 1974. This would be absurd, because the rest of the 1970s decade was marked by recessions and selloffs and not an improvement of earnings.
Other bull markets have similar anomalies. Where do you date the bull market that topped in 1966? From 1954? 1946? 1932? How about the 1929 peak before the Great Depression? Dating bull markets from bear market lows creates confusing, useless analyses.
This is not merely a matter of persnickety technical definitions. Defining when bull or bear markets begin and end can have a significant impact on investor psychology. The thinking seems to be that a 10-year bull market is old and therefore more likely to end sooner than a six-year-old one. Wrong: Age is irrelevant. Bull markets do not die of old age, they are killed by the sentiment of over-enthusiastic traders or by the actions of fearful central bankers.
So go ahead and raise a glass to March 9th, the low point of the bear market that sprung from the financial crisis. But save some champagne for March 28 — the real birthday of the bull market’s beginning in 2013, when it eclipsed the pre-crisis highs of Oct. 9, 2007.
_________
1. I almost agree with Mark Hulbert, who argues that recent 20-percent pullbacks mean the bull market ended and a new bear began. He is making the case for cyclical rallies, to which I am somewhat sympatico.
2. There are various points of views as to where that bull market began. Perhaps I should leave that debate to those technical traders who use Japanese candlestick charts rather than weigh in.
~~~
I originally published this at Bloomberg on 00,00,2018. All of my Bloomberg columns can be found here and here.
