
To hear an audio spoken word version of this post, click here.
Everybody seems to be having a hard time with the word “Transitory.” Part of this is due to the way people experience time in the modern era. Perhaps it would be helpful to reframe this differently, using a less temporal approach.
Consider this question: Are rising prices a “Structural” part of the economy? Are they a permanent fixture, part of the outlook for the cost of goods and services for the next decade or longer? If we are to dismiss “Transitory,” then we must, by definition, embrace inflation as “Structural.”
I don’t see this in most of the biggest price increases — they are not permanent parts of the economy. This is because — Warning: priors ahead! — the dominant price impetus the past three decades has been technology-induced Deflation. The more recent drivers of Inflation all look like pandemic/re-opening/supply chain driven, and therefore not structural.
Consider some of the bigger components of the recent record high CPI:
• Automobiles (new and used): One of the biggest drivers of higher prices has been the auto sector, even though they are only 7.8% of overall consumption (new vehicles = 3.83%; used = 3.29%). From March 2020 to August 2021, used car and truck prices have gone up 43.3% versus 11.7% for new vehicles versus U.S. inflation rate of 7.3% (currently 6.2%). This is clearly a re-opening issue caused by the semiconductor supply problems, not a structural change in car prices.
There are signs this has peaked and is abating: The CEO of Ford said the semiconductor shortage is improving but will extend into next year (September); the CEO of Volkswagen said we have “seen the worst” of the chip shortage (October); Toyota announced production lines in Japan are scheduled to operate normally for the first time in seven months (November). And last week, Morgan Stanley research noted chip production in Malaysia returned to full production; they expect car production (and chip intensive users like cloud data center servers) to improve in the near future.
All of the above is why prices for automobiles should begin to start normalizing in Q1 or Q2 2022. This is precisely what transitory inflation is versus structural inflation.
• Shelter: One of the largest components of inflation data is Shelter at 41.7% of CPI. This includes owned homes and rentals. The complication is there are over 95 million owned homes in America, about 2/3rds of which are owner-occupied. About 6 million of these change hands each year.
It is a complicated aspect of CPI: Housing has been disrupted by the low numbers of homes built in the years after the financial crisis; it was exasperated by the surge of urban dwellers looking for alternatives to cramped apartments during covid lockdowns.
And the so-called death of cities wasn’t merely exaggerated, it was dead wrong. Renters have returned to cities in large numbers, and the 2020 slashed rent prices we saw are returning to normal or above. Part of that big increase in rents is the unfavorable year-over-year comparables to the pandemic rent lows (and eviction moratorium). This will likely sort itself out over the next few quarters.
Those are the transitory parts of Shelter pricing, but other aspects of home prices are indeed structural: consider New Home Construction and changes to state and local regulations that prevent higher density land use. The good news is that new housing units under construction are now at the highest level since 1974; we should harbor no such illusion about the imminent elimination of NIMBYism anytime soon.
• Wages: The primary driver of rising wages has been the bottom half, in particular the bottom quartile. This is where compensation has lagged for decades and is now catching up. As noted yesterday, Real Median Wages were unchanged from 1979 to 2014; Real Minimum wages were the same in 2015 as they were in 1949.
What is occurring at the bottom of the wage scale is a massive unwind of decades of wages that were deflationary in nature. I expect these increases will be sticky, but the annualized gains will moderate. Hence, the best way to think of bottom half wages as part of a great reset.
We do have a supply-constrained labor force, due in part to reduced immigration, early retirements, workers leaving dead-end industries, lack of child care, and Covid deaths. This is contributing in part to those rising wages.
• Energy: Rose about 30% over the past year; this component is 7.3% of CPI. Some of this is supply-driven, but Energy has lots of cross-currents occurring within it: Prices fell after the 2008-09 crisis; that reduced the incentive for capital intensive fracking, which helped limit supply. There are some signs we will see more fracking in 2022.
The structural portion of this is the move from carbon to green energy. That social preference is helping to drive the prices of alternative energy lower. Solar, wind, and geothermal are still relatively small portions of total energy consumption, but they are rising. And, they are a technology not commodity -based energy source. They have the potential to be deflationary, not inflationary.
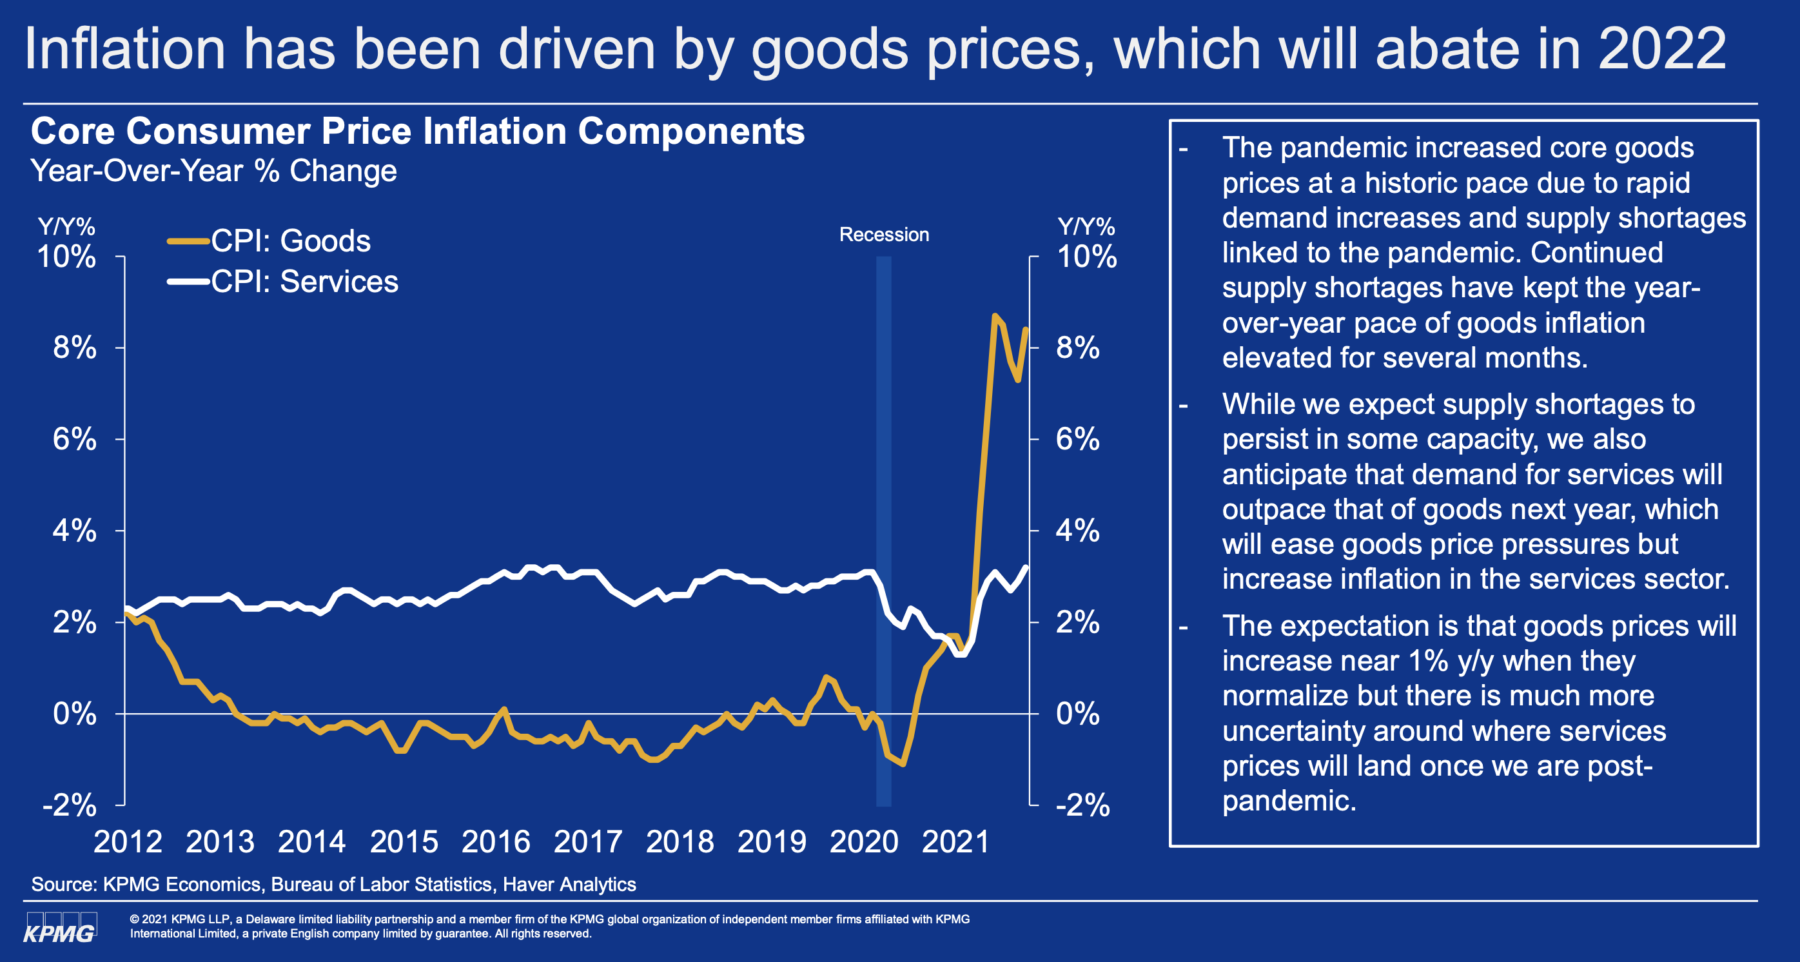
• Goods versus Services: Last, consider the balance between purchased Goods (38.7%) versus consumed Services (61.3%): As our chart shows, it is not the service economy driving rising prices, but rather the goods portion of the equation. CPI Goods are up over 8%, while CPI Services have recovered back to where they were pre covid — at about ~3% price increases.
This is a huge element in the inflation discussion.
Why? Part of this is driven by the changes that occurred during the pandemic lockdown, and that was a move towards goods and away from services. As an economy, we suddenly began buying food via Instacart/Amazon instead of going out to eat; we bought Peletons vs a gym membership; we purchased large screen TVs instead of going to the movies; we bought cars and Winnebagos instead of going on vacation.
In each of these instances, you purchased a physical good instead of using a service — and did so in quantities far outside of what is normally purchased. This is the opposite of the pre-pandemic trend. That the supply chain buckled under the load is not a surprise.
~~~
Prices have risen in many areas, and the question is whether the annualized rate of increase will stay high, or fall back to normal, from these elevated levels. I suspect we are two-thirds through a reset in prices, many of which will prove sticky, but are unlikely to continue at these elevated rates of change.
Low-end wages won’t go back to pre-pandemic levels, but used car prices and gasoline will; “Aspirational” single-family home prices are likely to go away as more supply comes online from new construction and more people selling their existing homes. Rentals are back in many places to pre-Covid levels, but the supply shock might be a substantial conversion of overbuilt office space to residential usage.
Many of the current prices we see are the “new normal,” but much of the current annualized rate of increase is not.
Previously:
How We Experience Time, Inflation Edition (November 10, 2021)
How Everybody Miscalculated Housing Demand (July 29, 2021)
Deflation, Punctuated by Spasms of Inflation (June 11, 2021)
Elvis (Your Waiter) Has Left the Building (July 9, 2021)
The Inflation Reset (June 1, 2021)
Shifting Balance of Power? (April 16, 2021)
click for audio
