
Yesterday’s explosive move higher was exactly the sort of thing traders should have been anticipating. As I wrote last month in Groping for a Bottom, it appeared the risks were highly one-sided:
“The risk here feels asymmetric: The downside appears to me as a potential grind lower — the Fed overtightens, then keeps over-tightening; maybe earnings miss badly; That mild recession we have been discussing — what if it turns out to be much worse than expected?
But the upside feels potentially explosive: One mild CPI print (imagine year-over-year with a 6-, or heaven forbid, a 5-handle!) or a really bad NFP report; what happens to the price of Oil when Russia pulls out of Ukraine?”
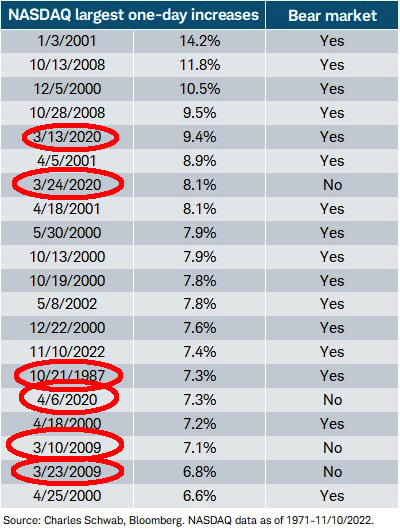
As seen in the table above, the 7.4% move higher in the Nasdaq was one of the 20 largest gains since 1971. But the table is off about a few things, and I wanted to pop out of my stupor (I have a mild case of Covid) to clarify a few things about what we are seeing.
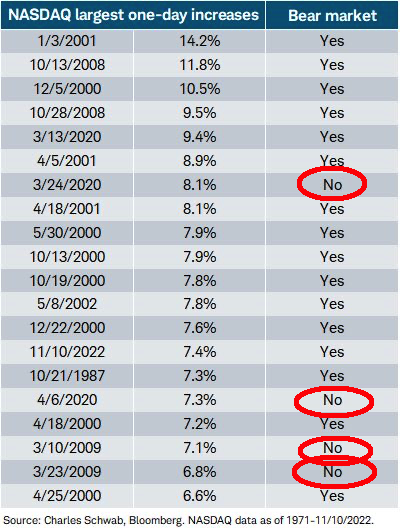 As J.C. correctly pointed out, the table mislabels what is and is not a bear market.1
You can use whatever definition you choose, but choose wisely, as selecting a description that poorly correlates to reality will hurt your investing and trading.
My position is that every single one of those listed big moves on the Nasdaq occurred within the context of a bear market (for the major big-cap indices). We also know from history that big moves up and down tend to cluster together in bear markets, making timing especially difficult.
But I highlighted above that it is in the first column where the table becomes really interesting: About 25% of the time, these giant moves higher mark the reversal of the prior trend. Meaning, that in about 1 in 4 times,2 a giant up move in the Nasdaq marks the end of the prior down-trend and the beginning of a much more constructive period. That is not enough to rely upon as a trading rule, but it should be enough to capture your attention.
As I observed yesterday:
We’ve been in a secular bull market since Summer 2020; sell-off this year = cyclical bear within the broader secular bull than a full-on secular bear market.
You never know what ends a cyclical bear but a giant thrust up on huge breadth + above average volume is a good start pic.twitter.com/Qb9ERgI4lz
— Barry Ritholtz (@ritholtz) November 10, 2022
I think that is a fair assessment of a market that seems to want to go higher in an economy that is still fairly robust, with lots of stimulus around and plenty of capital looking for a home.
Markets may have already worked the (highest probability) bad news into prices. The random factors remain War, FTX/Crypto, inflation, and 9as always) something else completely unforeseen. For sure, the FOMC could still screw this up, but we should be hopeful that they will find religion soon.
Of course, something could always come along to derail this — markets are probability exercises, not forecasting contests. But Thursday’s action was very encouraging.
Given the list of the 20 largest Nasdaq moves since 1971, it is not unreasonable to suggest that yesterday’s move reflects that asymmetric risk to the upside we discussed previously; and that markets are in the process bottoming, and yesterday could very well be a signal that we have lots more upside to go.
I remain constructive on equities and even short-duration bonds have grown far more attractive.
UPDATE: November 11, 2022 3:04pm
Ben makes a similar observation looking at the S&P 500:
Every other time we’ve seen a huge up day like this it’s either during a nasty bear market or at the tail end of one
So this one is either still going on or coming to an end
Very helpful, I know pic.twitter.com/ovo3DYoP0d
— Ben Carlson (@awealthofcs) November 10, 2022
Previously:
Groping for a Bottom (October 14, 2022)
7th Inning Stretch (September 30, 2022)
Countertrend? (August 15, 2022)
Big Up Big Down Days (May 5, 2022)
End of the Secular Bull? Not So Fast (April 3, 2020)
_______
1. I have defined Bull and Bear markets repeatedly, but the easiest way technicians use is to define when a bear market ends is when markets break out of the bear market trading range to make a new all-time high.
2. Actually, 6 out of 20, or 30%. To come up with a better statistic, we would need to see the full list of big up Nasdaq days as opposed to the top 20. Perhaps it’s all days over 3% or 4% or 5%; we cannot rely on merely tracking the top 20 and assuming that is a comprehensive enough data set.
