
Middle Class Now Holds Less Wealth than Top 1 Percent
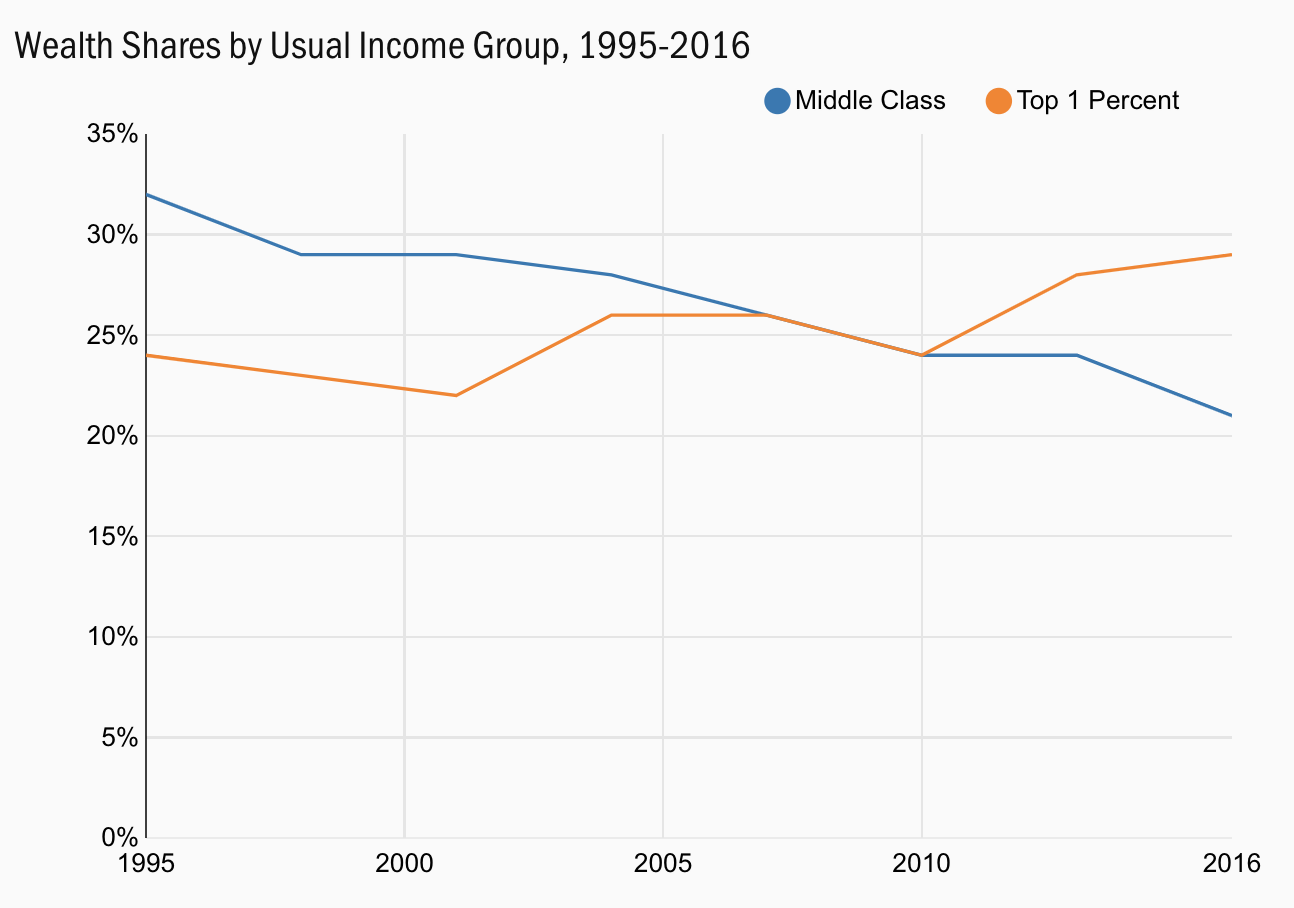
Note: Income groups are defined by usual income, a measure of family income where economic shocks are smoothed. The middle class makes up the second, third, and fourth usual income quintiles. SCF Bulletin Net Worth. 2016 dollars using CPI-U-RS.
Source: Survey of Consumer Finances and Brookings
How wealth in the United States is accumulated and divided today helps to explain the rise of Donald and Bernie.
This is no brilliant insight, but something implied by the data.
Some of this is caused by flux: everything is in a state of change, and that is difficult to understand, keep up with, to contextualize based upon your historical frame of reference. There is a lack of consensus about, well, pretty much everything these days: Economics, Markets, Technology, Politics, etc. This frightens people, sending them to cling onto comfortable myths.
But the world is not black and white, and reality is far more complex and nuanced than you get from much of the media or pundits or political candidates or elected officials.
I have studied and written about Wealth (and wages) in the United States for a long while; I suspect a fundamental misunderstanding of it lay at the base of this: How it gets created, who earns it, how it is spent, taxed, and redistributed is not well understood by the many, perhaps most people.
This is not well understood, leading to confusion: We have a robust economy yet still have lots of people not participating. We have an unemployment rate at 60-year lows, yet enormous sections of the labor pool are under-employed. Low inflation in the things we want, but higher inflation in the things people need. We simultaneously have great wealth and economic insecurity. That enormous wealth has flowed to mostly to Capital and asset holders, and not to workers or Labor.
This creates opportunities for those who recognize the angst early, and offer up a soothing balm of theory, myth and hope. That it all turns out to be false is almost secondary.
On the right, Donald Trump has perfected this form of popularism. On Reality TV, he played a character of a successful businessman (in real life, not so much). Only he can fix the challenges facing America, which was either an inflated economic bubble or in terrible shape before his election (there is a tweet for everything).
Many centrist voters bought into this in 2016, critically, in swing states.
On the left, Bernie Sanders has owned this space for decades (Elizabeth Warren is a relative latecomer). Any one of Bernie’s promises could be defended as reasonable social safety net expansion; taken in their entirety — free college, free health care, free retirement, 20% company ownership top employees, etc. — it is a broad reworking of the entire US economy into a European-style paternalism. My point is not that this is good or bad, but rather to explain its broad appeal to specific demographics.
Many young voters have bought into this; they historically vote in very low numbers compared to older voters, critically, in swing states like Florida.
I keep coming back to the changing distribution of wealth as the underlying factor in all of this. As the chart at the top shows, the long-term trend has been for the wealthiest to capture increasingly more of the economic pie than they historically have.
Today, the Top 1% is wealthier than all of the Middle Class. This is a relatively new, post GFC phenomena. It is driven primarily by the rise of asset prices: Stocks, Bonds, Real Estate and Business holdings.This is why the top 20% has recovered to pre-crisis income but the rest economic strata has not.
The opportunity for economic mobility has shrunk.
Call this what you will: A plutocracy, an oligopoly, a technocracy, a corporatocracy, a whatever — the massive Post-War middle class expansion that created so much wealth for ordinary families has morphed, starting around 1980, into something else entirely. Today, it has changed into low-tax economy that rewards capital and asset holders, and throws off much less towards the working class than it did last century.
Hence, the rise of Donald and Bernie. They both exhibit a more similar appeal to their base then you might imagine.
But here is the thing: It’s a small, rabid base that works best versus a broad pool of candidates. It is apparent that both Trump and Sanders benefited from the large field of competitors. There is an overlap between these two charts and each of their supports.
The unknown today is what happens if they go head to head? Who is best situated to beat the incumbent if it is not another populist?
I cannot answer these questions, but I suspect changing distributions of wealth in this country are going to drive the answers.
Only the Top 20 Percent Has Recovered Since the Great Recession
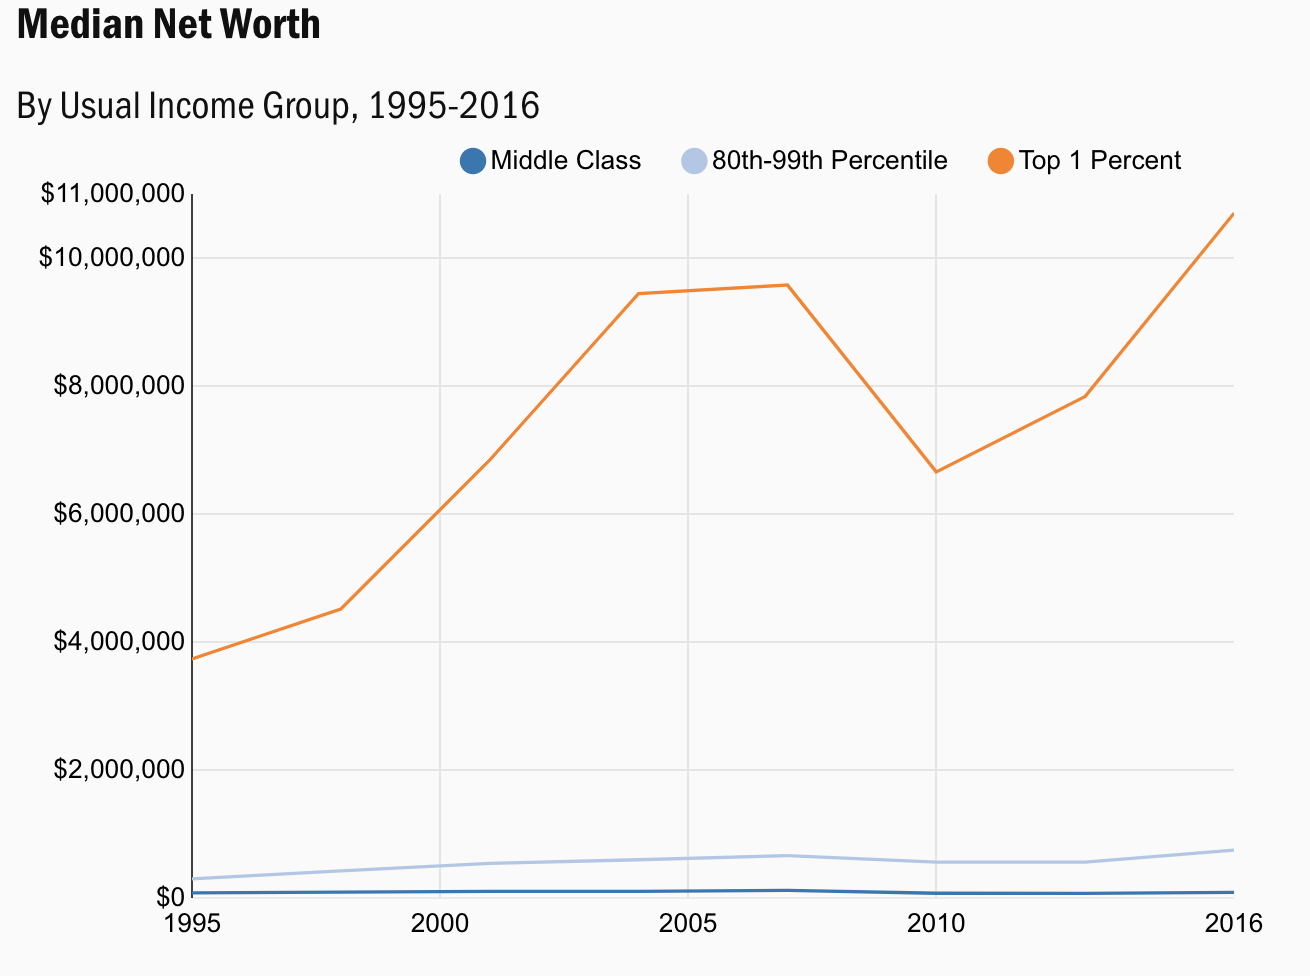
Note: Income groups are defined by usual income, a measure of family income where economic shocks are smoothed. The middle class makes up the second, third, and fourth usual income quintiles. The next group is the 80th to 98.9th percentiles. SCF Bulletin Net Worth. 2016 dollars using CPI-U-RS.
Source: Survey of Consumer Finances
Source: Brookings
Previously:
Understanding Wealth Comparisons
The Robust, No Good, Excellent, Terrible Recovery (October 3, 2018)
Wealth Distribution Analysis (July 18, 2019)
Top 1%: Wages up 158% since 1979 (December 20, 2019)
US Households: Half Spend More Than They Earn (January 10, 2020)
